Clinical Focus ›› 2024, Vol. 39 ›› Issue (8): 706-711.doi: 10.3969/j.issn.1004-583X.2024.08.005
Previous Articles Next Articles
Correlation of 25(OH)D and SUA/SCr with type 2 diabetes mellitus combined with non-alcoholic fatty liver disease
Xiong Lu1, Guo Lian2( )
)
- 1. School of Clinical Medicine,North Sichuan Medical College,Nanchong 637000,China
2. Department of Endocrinology and Metabolism,Three Gorges Hospital Affiliated to Chongqing University,Wanzhou 404000,China
-
Received:2024-01-31Online:2024-08-20Published:2024-09-03 -
Contact:Guo Lian,Email: aureny@163.com E-mail:aureny@163.com
CLC Number:
Cite this article
Xiong Lu, Guo Lian. Correlation of 25(OH)D and SUA/SCr with type 2 diabetes mellitus combined with non-alcoholic fatty liver disease[J]. Clinical Focus, 2024, 39(8): 706-711.
share this article
Add to citation manager EndNote|Ris|BibTeX
URL: http://www.lchc.cn/EN/10.3969/j.issn.1004-583X.2024.08.005
| 项目 | 单纯组( | 合并组( | ||
|---|---|---|---|---|
| 男性[例(%)] | 94(50.8) | 125(57.1) | 1.59 | 0.21 |
| 年龄(岁) | 61.16±11.78 | 57.06±14.11 | 3.89 | <0.05 |
| 体重(kg) | 60.00(52.00, 67.00) | 68.00(60.00, 75.00) | 7.24 | <0.01 |
| BMI(kg/m2) | 23.15(21.48, 25.10) | 25.69(23.53, 27.76) | 7.41 | <0.01 |
| 病程(年) | 8.00(1.00, 12.00) | 4.00(0.25, 10.00) | 3.91 | <0.01 |
| 收缩压(mmHg) | 126.00(113.50, 138.00) | 130.00(118.00, 142.00) | 2.41 | <0.05 |
| 舒张压(mmHg) | 77.00(70.00, 88.00) | 83.00(74.00, 90.00) | 3.49 | <0.01 |
| HbA1c(%) | 9.52±2.47 | 9.74±2.23 | 4.79 | 0.35 |
| LDL-C(mmol/L) | 2.78(1.99, 3.41) | 2.85(2.12, 3.54) | 0.77 | 0.44 |
| HDL-C(mmol/L) | 1.26(1.06, 1.47) | 1.05(0.82, 1.25) | 6.26 | <0.01 |
| TC(mmol/L) | 4.69(3.88, 5.40) | 4.78(4.04, 5.83) | 2.05 | <0.05 |
| TG(mmol/L) | 1.55(1.12, 2.62) | 2.34(1.57, 4.46) | 6.50 | <0.01 |
| 25(OH)D(ng/ml) | 16.32(11.75, 23.34) | 14.41(8.65, 19.60) | 3.33 | <0.01 |
| AST(U/L) | 17.00(13.35, 22.65) | 17.50(13.80, 22.60) | 0.62 | 0.53 |
| ALT(U/L) | 16.10(12.05, 24.25) | 19.20(14.80, 24.60) | 2.71 | <0.01 |
| GGT(U/L) | 19.00(13.00, 31.50) | 27.00(19.00, 45.00) | 5.64 | <0.01 |
| FPG(mmol/L) | 8.55(6.70, 11.11) | 8.67(7.14, 11.73) | 1.00 | 0.32 |
| HOMA-IR | 1.15(0.86, 1.56) | 4.87(2.83, 9.84) | 1.26 | <0.01 |
| SCr(μmol/L) | 65.00(56.00, 82.00) | 69.00(58.00, 83.00) | 1.66 | 0.10 |
| SUA(μmol/L) | 242.00(203.00, 313.00) | 338.00(279.00, 402.00) | 9.28 | <0.01 |
| SUA/SCr | 3.72(3.06, 4.58) | 4.65(3.75, 5.73) | 6.83 | <0.01 |
Tab.1 General and laboratory data between groups
| 项目 | 单纯组( | 合并组( | ||
|---|---|---|---|---|
| 男性[例(%)] | 94(50.8) | 125(57.1) | 1.59 | 0.21 |
| 年龄(岁) | 61.16±11.78 | 57.06±14.11 | 3.89 | <0.05 |
| 体重(kg) | 60.00(52.00, 67.00) | 68.00(60.00, 75.00) | 7.24 | <0.01 |
| BMI(kg/m2) | 23.15(21.48, 25.10) | 25.69(23.53, 27.76) | 7.41 | <0.01 |
| 病程(年) | 8.00(1.00, 12.00) | 4.00(0.25, 10.00) | 3.91 | <0.01 |
| 收缩压(mmHg) | 126.00(113.50, 138.00) | 130.00(118.00, 142.00) | 2.41 | <0.05 |
| 舒张压(mmHg) | 77.00(70.00, 88.00) | 83.00(74.00, 90.00) | 3.49 | <0.01 |
| HbA1c(%) | 9.52±2.47 | 9.74±2.23 | 4.79 | 0.35 |
| LDL-C(mmol/L) | 2.78(1.99, 3.41) | 2.85(2.12, 3.54) | 0.77 | 0.44 |
| HDL-C(mmol/L) | 1.26(1.06, 1.47) | 1.05(0.82, 1.25) | 6.26 | <0.01 |
| TC(mmol/L) | 4.69(3.88, 5.40) | 4.78(4.04, 5.83) | 2.05 | <0.05 |
| TG(mmol/L) | 1.55(1.12, 2.62) | 2.34(1.57, 4.46) | 6.50 | <0.01 |
| 25(OH)D(ng/ml) | 16.32(11.75, 23.34) | 14.41(8.65, 19.60) | 3.33 | <0.01 |
| AST(U/L) | 17.00(13.35, 22.65) | 17.50(13.80, 22.60) | 0.62 | 0.53 |
| ALT(U/L) | 16.10(12.05, 24.25) | 19.20(14.80, 24.60) | 2.71 | <0.01 |
| GGT(U/L) | 19.00(13.00, 31.50) | 27.00(19.00, 45.00) | 5.64 | <0.01 |
| FPG(mmol/L) | 8.55(6.70, 11.11) | 8.67(7.14, 11.73) | 1.00 | 0.32 |
| HOMA-IR | 1.15(0.86, 1.56) | 4.87(2.83, 9.84) | 1.26 | <0.01 |
| SCr(μmol/L) | 65.00(56.00, 82.00) | 69.00(58.00, 83.00) | 1.66 | 0.10 |
| SUA(μmol/L) | 242.00(203.00, 313.00) | 338.00(279.00, 402.00) | 9.28 | <0.01 |
| SUA/SCr | 3.72(3.06, 4.58) | 4.65(3.75, 5.73) | 6.83 | <0.01 |
| 性别 | 年龄 (岁) | 体重 (kg) | BMI (kg/m2) | 病程 (年) | 收缩压 (mmHg) | 舒张压 (mmHg) | HbA1c (%) | LDL-C (mmol/L) | HDL-C (mmol/L) | |
|---|---|---|---|---|---|---|---|---|---|---|
| -0.08 | 0.04 | -0.03 | -0.10 | 0.06 | -0.02 | 0.05 | -0.10 | -0.01 | 0.05 | |
| 0.11 | 0.41 | 0.51 | 0.04 | 0.20 | 0.70 | 0.33 | 0.04 | 0.83 | 0.33 | |
| TC (mmol/L) | TG (mmol/L) | AST (U/L) | ALT (U/L) | GGT (U/L) | FPG (mmol/L) | HOMA-IR | SCr (μmol/L) | SUA (μmol/L) | SUA/SCr | |
| -0.03 | -0.06 | 0.06 | 0.03 | -0.01 | -0.08 | -0.03 | 0.11 | 0.02 | -0.03 | |
| 0.59 | 0.21 | 0.25 | 0.50 | 0.78 | 0.11 | 0.55 | 0.03 | 0.64 | 0.56 |
Tab.2 Correlation analysis of 25(OH)D with other clinical indicators
| 性别 | 年龄 (岁) | 体重 (kg) | BMI (kg/m2) | 病程 (年) | 收缩压 (mmHg) | 舒张压 (mmHg) | HbA1c (%) | LDL-C (mmol/L) | HDL-C (mmol/L) | |
|---|---|---|---|---|---|---|---|---|---|---|
| -0.08 | 0.04 | -0.03 | -0.10 | 0.06 | -0.02 | 0.05 | -0.10 | -0.01 | 0.05 | |
| 0.11 | 0.41 | 0.51 | 0.04 | 0.20 | 0.70 | 0.33 | 0.04 | 0.83 | 0.33 | |
| TC (mmol/L) | TG (mmol/L) | AST (U/L) | ALT (U/L) | GGT (U/L) | FPG (mmol/L) | HOMA-IR | SCr (μmol/L) | SUA (μmol/L) | SUA/SCr | |
| -0.03 | -0.06 | 0.06 | 0.03 | -0.01 | -0.08 | -0.03 | 0.11 | 0.02 | -0.03 | |
| 0.59 | 0.21 | 0.25 | 0.50 | 0.78 | 0.11 | 0.55 | 0.03 | 0.64 | 0.56 |
| 性别 | 年龄 (岁) | 体重 (kg) | BMI (kg/m2) | 病程 (年) | 收缩压 (mmHg) | 舒张压 (mmHg) | HbA1c (%) | LDL-C (mmol/L) | |||||||||
|---|---|---|---|---|---|---|---|---|---|---|---|---|---|---|---|---|---|
| 0.07 | -0.34 | 0.06 | 0.05 | -0.18 | -0.10 | 0.10 | 0.04 | 0.10 | |||||||||
| 0.16 | <0.01 | 0.30 | 0.29 | <0.01 | <0.05 | <0.05 | 0.44 | 0.04 | |||||||||
| HDL-C (mmol/L) | TC (mmol/L) | TG (mmol/L) | AST (U/L) | ALT (U/L) | GGT (U/L) | FPG (mmol/L) | HOMA-IR | ||||||||||
| -0.14 | 0.10 | 0.74 | 0.10 | 0.10 | 0.13 | 0.02 | 0.16 | ||||||||||
| 0.01 | 0.04 | <0.01 | 0.05 | 0.04 | 0.01 | 0.71 | <0.01 | ||||||||||
Tab.3 Correlation analysis between SUA/SCr and other clinical indicators
| 性别 | 年龄 (岁) | 体重 (kg) | BMI (kg/m2) | 病程 (年) | 收缩压 (mmHg) | 舒张压 (mmHg) | HbA1c (%) | LDL-C (mmol/L) | |||||||||
|---|---|---|---|---|---|---|---|---|---|---|---|---|---|---|---|---|---|
| 0.07 | -0.34 | 0.06 | 0.05 | -0.18 | -0.10 | 0.10 | 0.04 | 0.10 | |||||||||
| 0.16 | <0.01 | 0.30 | 0.29 | <0.01 | <0.05 | <0.05 | 0.44 | 0.04 | |||||||||
| HDL-C (mmol/L) | TC (mmol/L) | TG (mmol/L) | AST (U/L) | ALT (U/L) | GGT (U/L) | FPG (mmol/L) | HOMA-IR | ||||||||||
| -0.14 | 0.10 | 0.74 | 0.10 | 0.10 | 0.13 | 0.02 | 0.16 | ||||||||||
| 0.01 | 0.04 | <0.01 | 0.05 | 0.04 | 0.01 | 0.71 | <0.01 | ||||||||||
| 指标 | β | 标准误 | 95% | |||
|---|---|---|---|---|---|---|
| 下限 | 上限 | |||||
| SUA/SCr>4.46 | 1.424 | 0.513 | 4.16 | <0.01 | 1.52 | 11.35 |
| 病程 | -0.097 | 0.040 | 0.91 | 0.014 | 0.84 | 0.98 |
| 25(OH)D | -0.15 | 0.000 | 0.86 | <0.01 | 0.80 | 0.92 |
| GGT | 0.014 | 0.044 | 1.02 | 0.044 | 1.00 | 1.03 |
Tab.4 Multivariate logistic regression analysis for NAFLD in T2DM patients
| 指标 | β | 标准误 | 95% | |||
|---|---|---|---|---|---|---|
| 下限 | 上限 | |||||
| SUA/SCr>4.46 | 1.424 | 0.513 | 4.16 | <0.01 | 1.52 | 11.35 |
| 病程 | -0.097 | 0.040 | 0.91 | 0.014 | 0.84 | 0.98 |
| 25(OH)D | -0.15 | 0.000 | 0.86 | <0.01 | 0.80 | 0.92 |
| GGT | 0.014 | 0.044 | 1.02 | 0.044 | 1.00 | 1.03 |
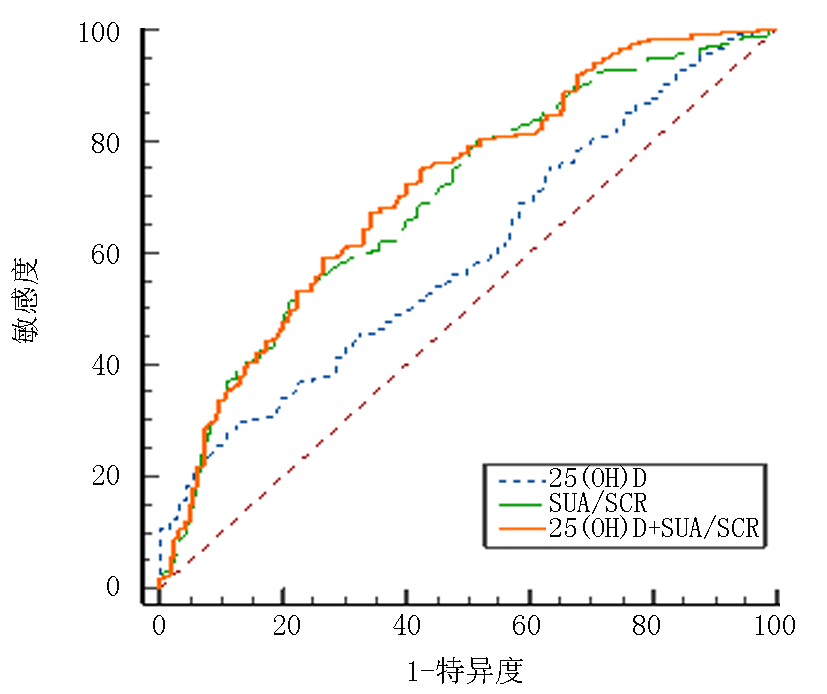
Fig.1 ROC curve of 25(OH)D, SUA/SCr, and their combination in predicting T2DM patients complicated with NAFLD
| 变量 | 曲线下面积 | 敏感度 | 特异度 | 截断值 | 95% | ||
|---|---|---|---|---|---|---|---|
| 下限 | 上限 | ||||||
| 25(OH)D | 0.596 | 28.3% | 88.6% | 9.00 | <0.01 | 0.547 | 0.645 |
| SUA/SCr | 0.697 | 51.1% | 78.9% | 4.46 | <0.01 | 0.650 | 0.742 |
| 25(OH)D联合SUA/SCr | 0.714 | 67.1% | 65.9% | 0.13 | <0.01 | 0.667 | 0.757 |
Tab.5 Predictive value of 25 (OH) D, SCr/SUA, and their combination for T2DM patients complicated with NAFLD
| 变量 | 曲线下面积 | 敏感度 | 特异度 | 截断值 | 95% | ||
|---|---|---|---|---|---|---|---|
| 下限 | 上限 | ||||||
| 25(OH)D | 0.596 | 28.3% | 88.6% | 9.00 | <0.01 | 0.547 | 0.645 |
| SUA/SCr | 0.697 | 51.1% | 78.9% | 4.46 | <0.01 | 0.650 | 0.742 |
| 25(OH)D联合SUA/SCr | 0.714 | 67.1% | 65.9% | 0.13 | <0.01 | 0.667 | 0.757 |
| [1] | Ruan S, Yuan X, Liu J, et al. Predictors of high cardiovascular risk among nonobese patients with type 2 diabetes and non-alcoholic fatty liver disease in a Chinese population[J]. Diabetes Metab Syndr Obes, 2024, 17:493-506. |
| [2] |
Cai J, Zhang Z, Liu J, et al. Correlation between serum 25-OH vitamin D expression and non-alcoholic fatty liver disease[J]. Exp Ther Med, 2020, 19(3):1681-1686.
doi: 10.3892/etm.2020.8411 pmid: 32104220 |
| [3] | Xing Y, Cheng T, Zhou F, et al. The association between vitamin D and type 2 diabetes mellitus complicated with non-alcoholic fatty liver disease: An observational cross-sectional study[J]. Diabetes Metab Syndr Obes, 2022, 15:269-280. |
| [4] |
Wang X, Han Y, Liu Y, et al. Association between serum uric acid-to-creatinine ratio and non-alcoholic fatty liver disease: A cross-sectional study in Chinese non-obese people with a normal range of low-density lipoprotein cholesterol[J]. BMC Gastroenterol, 2022, 22(1):419.
doi: 10.1186/s12876-022-02500-w pmid: 36104672 |
| [5] | 周莉萍. 龈沟液 sCD40L、sCXCL-16 和 PCT 水平预测 2 型糖尿病发生慢性牙周炎的临床价值[J]. 检验医学与临床, 2022, 19(14):1912-1916, 1921. |
| [6] | 中华医学会肝脏病学分会脂肪肝和酒精性肝病学组. 非酒精性脂肪性肝病诊疗指南[J]. 临床肝胆病杂志, 2010, 26(2):120-124. |
| [7] | Wimalawansa SJ. Associations of vitamin D with insulin resistance, obesity, type 2 diabetes, and metabolic syndrome[J]. J Steroid Biochem, 2018, 175:177-189. |
| [8] | Sun DQ, Wu SJ, Liu WY, et al. Serum uric acid: A new therapeutic target for nonalcoholic fatty liver disease[J]. Expert Opin Ther Targets, 2016, 20(3):375-387. |
| [9] | Niu Y, Zhang W, Zhang H, et al. Serum creatinine levels and risk of nonalcohol fatty liver disease in a middle-aged and older Chinese population: A cross-sectional analysis[J]. Diabetes Metab Res Rev, 2022, 38(2):e3489. |
| [10] | Ma C, Liu Y, He S, et al. C-peptide: A mediator of the association between serum uric acid to creatinine ratio and non-alcoholic fatty liver disease in a Chinese population with normal serum uric acid levels[J]. Front Endocrinol (Lausanne), 2020, 11:600472. |
| [11] | 张强, 刘勤, 牛春燕. 利拉鲁肽减轻脂毒性肝细胞损伤并促进自噬改善非酒精性脂肪肝[J]. 中华肝脏病杂志, 2021, 29(5):456-461. |
| [12] | Kawamoto R, Ninomiya D, Kikuchi A, et al. Serum uric acid to creatinine ratio is a useful predictor of renal dysfunction among diabetic persons[J]. Diabetes Metab Synd, 2019, 13(3):1851-1856. |
| [13] | Park E, Park EY. Inverse association between serum 25-hydroxyvitamin D levels and risk of suspected non-alcoholic fatty liver disease in obese population[J]. Int J Environ Res Public Health, 2021, 18(16):8682. |
| [14] | Pirgon O, Cekmez F, Bilgin H, et al. Low 25-hydroxyvitamin D level is associated with insulin sensitivity in obese adolescents with non-alcoholic fatty liver disease[J]. Obes Res Clin Pract, 2013, 7(4):e275-83. |
| [15] |
Yin Y, Yu Z, Xia M, et al. Vitamin D attenuates high fat diet-induced hepatic steatosis in rats by modulating lipid metabolism[J]. Eur J Clin Invest, 2012, 42(11):1189-96.
doi: 10.1111/j.1365-2362.2012.02706.x pmid: 22958216 |
| [16] |
Zhang Y, Li J, Ni Y, et al. Correlational study on the levels of 25-hydroxyvitamin D and non-alcoholic fatty liver disease in type 2 diabetic patients[J]. BMC Endocr Disord, 2021, 21(1):100.
doi: 10.1186/s12902-021-00762-1 pmid: 34006273 |
| [17] |
Ning C, Liu L, Lv G, et al. Lipid metabolism and inflammation modulated by vitamin D in liver of diabetic rats[J]. Lipids Health Dis, 2015, 14:31.
doi: 10.1186/s12944-015-0030-5 pmid: 25899686 |
| [18] | Choi J, Joe H, Oh JE, et al. The correlation between NAFLD and serum uric acid to serum creatinine ratio[J]. PLoS One, 2023, 18(7):e0288666. |
| [19] | Wang M, Wang M, Zhang R, et al. A combined association of serum uric acid, alanine aminotransferase and waist circumference with non-alcoholic fatty liver disease: A community-based study[J]. PeerJ, 2022, 10:e13022. |
| [20] | Wang R, Xue F, Wang L, et al. Serum uric acid to creatinine ratio is associated with higher prevalence of NAFLD detected by fibroscan in the United States[J]. J Clin Lab Anal, 2022, 36(8):e24590. |
| [21] |
Lee JM, Kim HW, Heo SY, et al. Associations of serum uric acid level with liver enzymes, nonalcoholic fatty liver disease, and liver fibrosis in Korean men and women: A cross-sectional study using nationally representative data[J]. J Korean Med Sci, 2023, 38(34):e267.
doi: 10.3346/jkms.2023.38.e267 pmid: 37644682 |
| Viewed | ||||||
|
Full text |
|
|||||
|
Abstract |
|
|||||