Clinical Focus ›› 2025, Vol. 40 ›› Issue (3): 251-256.doi: 10.3969/j.issn.1004-583X.2025.03.010
Previous Articles Next Articles
Value of T2WI signal intensity and gadobemeglumine enhanced MRI hepatobiliary phase parameters in evaluating liver function of cirrhosis patients
Lin Tao, Du Taoming( ), Li Ya, Feng Yuling, Song Huizhen, Yu Qin
- Department of Radiology, Chengdu Seventh People's Hospital, Chengdu 610000, China
-
Received:2024-11-27Online:2025-03-20Published:2025-03-25 -
Contact:Du Taoming E-mail:dtm0528@sina.com
CLC Number:
Cite this article
Lin Tao, Du Taoming, Li Ya, Feng Yuling, Song Huizhen, Yu Qin. Value of T2WI signal intensity and gadobemeglumine enhanced MRI hepatobiliary phase parameters in evaluating liver function of cirrhosis patients[J]. Clinical Focus, 2025, 40(3): 251-256.
share this article
Add to citation manager EndNote|Ris|BibTeX
URL: http://www.lchc.cn/EN/10.3969/j.issn.1004-583X.2025.03.010
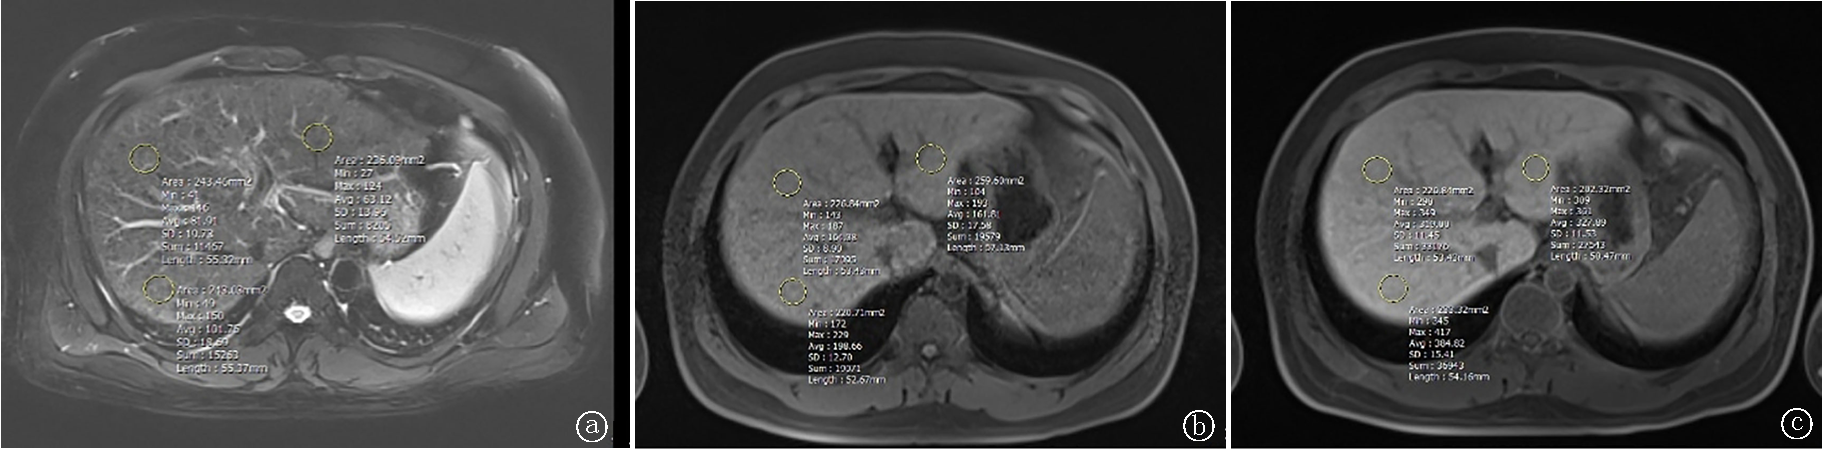
Fig.1 MRI images of a 34-year-old male with the liver function of Child-Pugh grade A a.T2WI; b. Plain scan; c. Hepatobiliary stage at 90 min
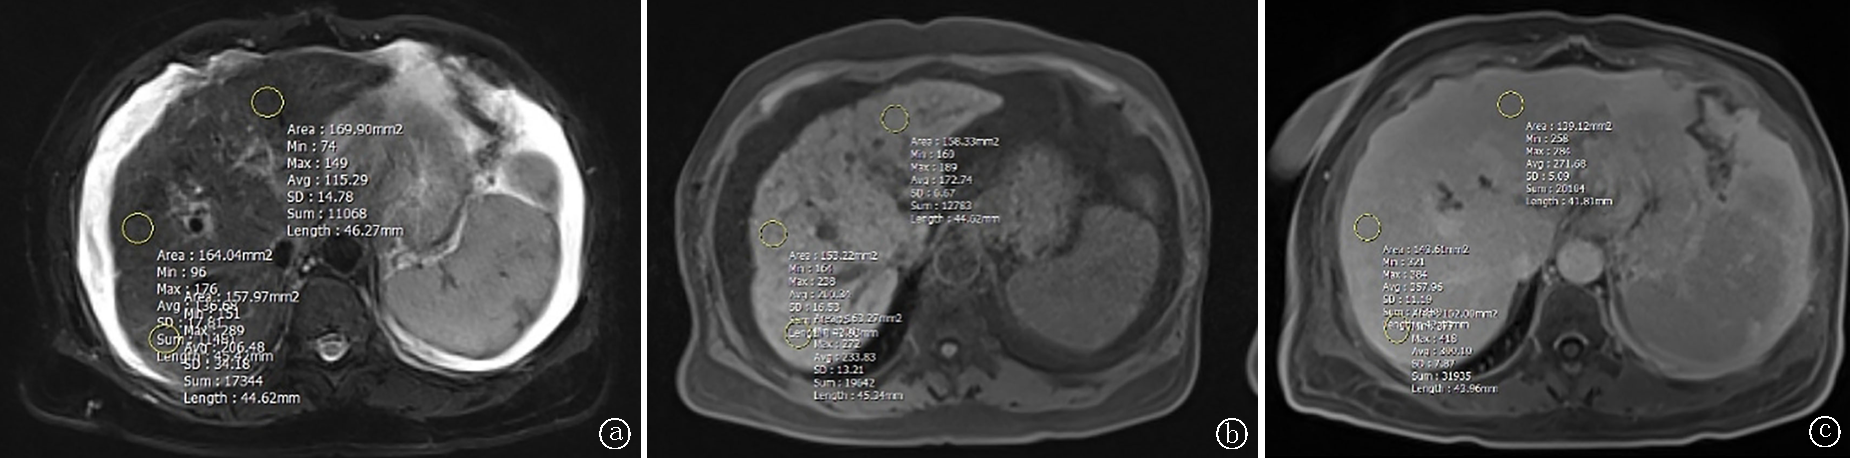
Fig.2 MRI images of a 73-year-old male patient with the liver function of Child-Pugh grade B a.T2WI; b. Plain scan; c. Hepatobiliary stage 90 min
| 组别 | 例数 | BMI (kg/m2) | 性别[例(%)] | 年龄 (岁) | 乙型肝炎背景[例(%)] | AST[例(%)] | ALT[例(%)] | GGT[例(%)] | ||||||||
|---|---|---|---|---|---|---|---|---|---|---|---|---|---|---|---|---|
| 男 | 女 | 有 | 无 | ≤40 U/L | >40 U/L | ≤50 U/L | >50 U/L | ≤60 U/L | >60 U/L | |||||||
| A组 | 20 | 23.25±2.52 | 15(75.0) | 5(25.0) | 59.10±13.09 | 10(50.0) | 10(50.0) | 5(25.0) | 15(75.0) | 10(50.0) | 10(50.0) | 6(30.0) | 14(70.0) | |||
| B组 | 22 | 25.54±4.26 | 19(86.4) | 3(13.6) | 58.23±12.01 | 14(63.6) | 8(36.4) | 5(22.7) | 17(77.3) | 13(59.1) | 9(40.9) | 5(22.7) | 17(77.3) | |||
| C组 | 15 | 24.98±4.27 | 11(73.3) | 4(26.7) | 64.67±11.08 | 9(60.0) | 6(40.0) | 5(33.3) | 10(66.7) | 8(53.3) | 7(46.7) | 3(20.0) | 12(80.0) | |||
| 统计值 | t=2.063 | χ2=1.200 | t=1.379 | χ2=0.836 | χ2=0.545 | χ2=0.358 | χ2=0.528 | |||||||||
| P值 | 0.137 | 0.549 | 0.260 | 0.658 | 0.762 | 0.836 | 0.768 | |||||||||
Tab.1 Comparison of general data among the three groups
| 组别 | 例数 | BMI (kg/m2) | 性别[例(%)] | 年龄 (岁) | 乙型肝炎背景[例(%)] | AST[例(%)] | ALT[例(%)] | GGT[例(%)] | ||||||||
|---|---|---|---|---|---|---|---|---|---|---|---|---|---|---|---|---|
| 男 | 女 | 有 | 无 | ≤40 U/L | >40 U/L | ≤50 U/L | >50 U/L | ≤60 U/L | >60 U/L | |||||||
| A组 | 20 | 23.25±2.52 | 15(75.0) | 5(25.0) | 59.10±13.09 | 10(50.0) | 10(50.0) | 5(25.0) | 15(75.0) | 10(50.0) | 10(50.0) | 6(30.0) | 14(70.0) | |||
| B组 | 22 | 25.54±4.26 | 19(86.4) | 3(13.6) | 58.23±12.01 | 14(63.6) | 8(36.4) | 5(22.7) | 17(77.3) | 13(59.1) | 9(40.9) | 5(22.7) | 17(77.3) | |||
| C组 | 15 | 24.98±4.27 | 11(73.3) | 4(26.7) | 64.67±11.08 | 9(60.0) | 6(40.0) | 5(33.3) | 10(66.7) | 8(53.3) | 7(46.7) | 3(20.0) | 12(80.0) | |||
| 统计值 | t=2.063 | χ2=1.200 | t=1.379 | χ2=0.836 | χ2=0.545 | χ2=0.358 | χ2=0.528 | |||||||||
| P值 | 0.137 | 0.549 | 0.260 | 0.658 | 0.762 | 0.836 | 0.768 | |||||||||
| 观察者 | SIT2(×102) | SI肝胆期(×102) | SI平扫(×102) |
|---|---|---|---|
| 观察者1 | 1.02±0.29 | 2.95±0.57 | 1.80±0.37 |
| 观察者2 | 1.19±0.30 | 3.23±0.53 | 1.97±0.34 |
| ICC值 | 0.830 | 0.920 | 0.900 |
Tab.2 Consistency testing of each parameter measured by two observers
| 观察者 | SIT2(×102) | SI肝胆期(×102) | SI平扫(×102) |
|---|---|---|---|
| 观察者1 | 1.02±0.29 | 2.95±0.57 | 1.80±0.37 |
| 观察者2 | 1.19±0.30 | 3.23±0.53 | 1.97±0.34 |
| ICC值 | 0.830 | 0.920 | 0.900 |
| 组别 | 例数 | SIT2 (×102) | SI平扫 (×102) | SI肝胆期 (×102) | RE |
|---|---|---|---|---|---|
| A组 | 20 | 1.05±0.23 | 1.94±0.35 | 3.49±0.56 | 0.82±0.27 |
| B组 | 22 | 1.18±0.24 | 2.03±0.27 | 3.16±0.48* | 0.57±0.24* |
| C组 | 15 | 1.39±0.36*# | 1.97±0.34 | 2.99±0.53*# | 0.57±0.21*# |
| F值 | 6.680 | 0.490 | 4.730 | 6.960 | |
| P值 | 0.003 | 0.616 | 0.013 | 0.002 |
Tab.3 Comparison of parameters among the three groups
| 组别 | 例数 | SIT2 (×102) | SI平扫 (×102) | SI肝胆期 (×102) | RE |
|---|---|---|---|---|---|
| A组 | 20 | 1.05±0.23 | 1.94±0.35 | 3.49±0.56 | 0.82±0.27 |
| B组 | 22 | 1.18±0.24 | 2.03±0.27 | 3.16±0.48* | 0.57±0.24* |
| C组 | 15 | 1.39±0.36*# | 1.97±0.34 | 2.99±0.53*# | 0.57±0.21*# |
| F值 | 6.680 | 0.490 | 4.730 | 6.960 | |
| P值 | 0.003 | 0.616 | 0.013 | 0.002 |
| 参数 | AUC | 95%CI | 界值 | 敏感度 | 特异度 | |
|---|---|---|---|---|---|---|
| 下限 | 上限 | |||||
| SIT2(×102) | 0.715 | 0.580 | 0.827 | 1.07 | 0.810 | 0.600 |
| SI肝胆期(×102) | 0.707 | 0.571 | 0.820 | 3.25 | 0.676 | 0.700 |
| RE | 0.757 | 0.625 | 0.861 | 0.69 | 0.811 | 0.700 |
| SIT2+SI肝胆期+RE | 0.846 | 0.726 | 0.928 | 0.64 | 0.784 | 0.800 |
Tab.4 The predictive value of each indicator for Child-Pugh grade B+C
| 参数 | AUC | 95%CI | 界值 | 敏感度 | 特异度 | |
|---|---|---|---|---|---|---|
| 下限 | 上限 | |||||
| SIT2(×102) | 0.715 | 0.580 | 0.827 | 1.07 | 0.810 | 0.600 |
| SI肝胆期(×102) | 0.707 | 0.571 | 0.820 | 3.25 | 0.676 | 0.700 |
| RE | 0.757 | 0.625 | 0.861 | 0.69 | 0.811 | 0.700 |
| SIT2+SI肝胆期+RE | 0.846 | 0.726 | 0.928 | 0.64 | 0.784 | 0.800 |
| 参数 | AUC差值 | Z值 | P值 |
|---|---|---|---|
| SIT2与SI肝胆期 | 0.008 | 0.071 | 0.944 |
| SIT2与RE | 0.042 | 0.435 | 0.664 |
| SIT2与SIT2+SI肝胆期+RE | 0.131 | 1.848 | 0.065 |
| SI肝胆期与RE | 0.050 | 0.625 | 0.532 |
| SI肝胆期与SIT2+SI肝胆期+RE | 0.139 | 2.313 | 0.021 |
| RE与SIT2+SI肝胆期+RE | 0.089 | 1.852 | 0.064 |
Tab.5 Comparison results of Delong test for each AUC
| 参数 | AUC差值 | Z值 | P值 |
|---|---|---|---|
| SIT2与SI肝胆期 | 0.008 | 0.071 | 0.944 |
| SIT2与RE | 0.042 | 0.435 | 0.664 |
| SIT2与SIT2+SI肝胆期+RE | 0.131 | 1.848 | 0.065 |
| SI肝胆期与RE | 0.050 | 0.625 | 0.532 |
| SI肝胆期与SIT2+SI肝胆期+RE | 0.139 | 2.313 | 0.021 |
| RE与SIT2+SI肝胆期+RE | 0.089 | 1.852 | 0.064 |
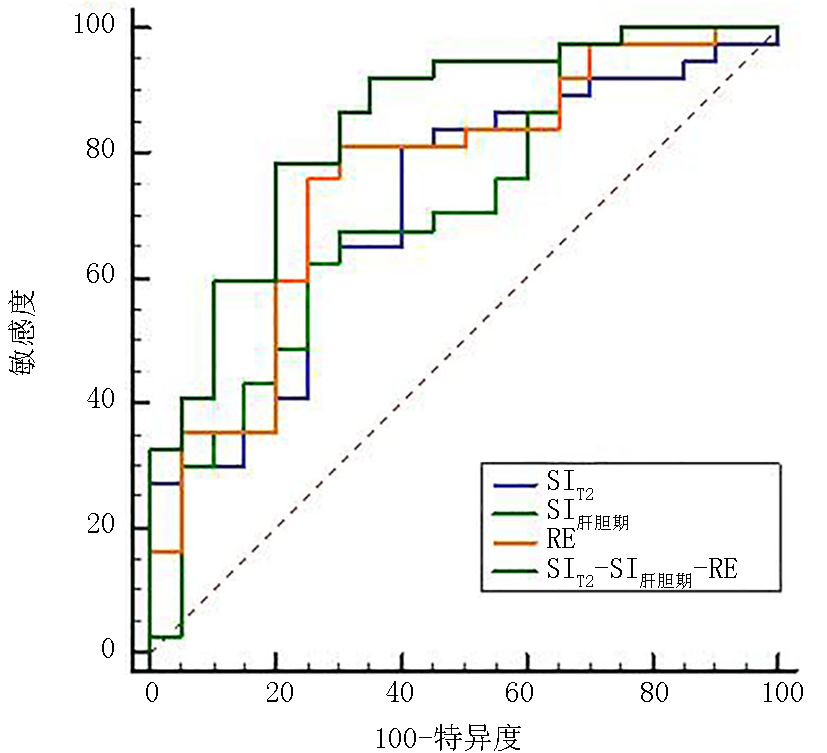
Fig.3 ROC curve of each index in predicting Child-Pugh B+C
| [1] |
Asrani SK, Devarbhavi H, Eaton J, et al. Burden of liver diseases in the world[J]. J Hepatol, 2019, 70(1): 151-171.
doi: S0168-8278(18)32388-2 pmid: 30266282 |
| [2] | Ginès P, Krag A, Abraldes JG, et al. Liver cirrhosis[J]. Lancet, 2021, 398(10308):1359-1376. |
| [3] |
Haimerl M, Verloh N, Zeman F, et al. Gd-EOB-DTPA-enhanced MRI for evaluation of liver function: Comparison between signal-intensity-based indices and T1 relaxometry[J]. Sci Rep, 2017, 7:43347.
doi: 10.1038/srep43347 pmid: 28266528 |
| [4] | Yip TC, Lyu F, Lin H, et al. Non-invasive biomarkers for liver inflammation in non-alcoholic fatty liver disease: Present and future[J]. Clin Mol Hepatol, 2023, 29(Suppl):S171-S183. |
| [5] | Tang A. Liver stiffness at MR elastography: A surrogate biomarker for staging liver fibrosis, predicting clinical outcomes, and selecting patients[J]. Radiology, 2024, 311(2):e240890. |
| [6] |
Wells ML, Fenstad ER, Poterucha JT, et al. Imaging findings of congestive hepatopathy[J]. Radiographics, 2016, 36(4):1024-1037.
doi: 10.1148/rg.2016150207 pmid: 27284758 |
| [7] |
Noone TC, Semelka RC, Siegelman ES, et al. Budd-chiari syndrome:Spectrum of appearances of acute,subacute,and chronic disease with magnetic resonance imaging[J]. J Magn Reson Imaging, 2000, 11(1):44-50.
doi: 10.1002/(sici)1522-2586(200001)11:1<44::aid-jmri6>3.0.co;2-o pmid: 10676619 |
| [8] |
Dahlqvist Leinhard O, Dahlström N, Kihlberg J, et al. Quantifying differences in hepatic uptake of the liver specific contrast agents Gd-EOB-DTPA and Gd-BOPTA: A pilot study[J]. Eur Radiol, 2012, 22(3): 642-653.
doi: 10.1007/s00330-011-2302-4 pmid: 21984449 |
| [9] | Pastor CM, Wissmeyer M, Millet P. Concentrations of Gd-BOPTA in cholestatic fatty rat livers: Role of transport functions through membrane proteins[J]. Contrast Media Mol Imaging, 2013, 8(2): 147-156. |
| [10] | Manizate F, Hiotis SP, Labow D, et al. Liver functional reserve estimation:State of the art and relevance to local treatments[J]. Oncology, 2010, 78(11):131-134. |
| [11] | Tralhao JG, Hoti E, Oliveros B, et al. Study of perioperative liver function by dynamic monitoring of ICG-clearance[J]. Hepatogastroenterology, 2012, 59(116):1179-1183. |
| [12] | Granito A, Bolondi L. Non-transplant therapies for patients with hepatocellular carcinoma and Child-Pugh-Turcotte class B cirrhosis[J]. Lancet Oncol, 2017, 18(2): e101-e112. |
| [13] | Sharma P. Value of liver function tests in cirrhosis[J]. J Clin Exp Hepatol, 2022, 12(3):948-964. |
| [14] | Demirtas CO, D'Alessio A, Rimassa L, et al. ALBI grade: Evidence for an improved model for liver functional estimation in patients with hepatocellular carcinoma[J]. JHEP Rep, 2021, 3(5):100347. |
| [15] |
King J, Palmer DH, Johnson P, et al. Sorafenib for the treatment of advanced hepatocellular cancer-a UK audit[J]. Clin Oncol (R Coll Radiol), 2017, 29(4):256-262.
doi: S0936-6555(16)30413-7 pmid: 27964898 |
| [16] | Chow AM, Gao DS, Fan SJ, et al. Measurement of liver T1 and T2 relaxation times in an experimental mouse model of liver fibrosis[J]. J Magn Reson Imaging, 2012, 36(1):152-158. |
| [17] | Heye T, Yang SR, Bock M, et al. MR relaxometry of the liver: Significant elevation of T1 relaxation time in patients with liver cirrhosis[J]. Eur Radiol, 2012, 22(6):1224-1232. |
| [18] | Cassinotto C, Feldis M, Vergniol J, et al. MR relaxometry in chronic liver diseases: Comparison of T1 mapping, T 2 mapping, and diffusion-weighted imaging for assessing cirrhosis diagnosis and severity[J]. Eur J Radiol, 2015, 84(8):1459-1465. |
| [19] |
Zhou X, Long L, Mo Z, et al. OATP1B3 expression in hepatocellular carcinoma correlates with intralesional Gd-EOB-DTPA uptake and signal intensity on Gd-EOB-DTPA-enhanced MRI[J]. Cancer Manag Res, 2021, 13:1169-1177.
doi: 10.2147/CMAR.S292197 pmid: 33603462 |
| [20] | Pastor C, Wissmeyer M, Millet P. Concentrations of Gd-BOPTA in cholestatic fatty rat livers: Role of transport functions through membrane proteins[J]. Contrast Media Mol Imaging, 2013, 8(2):147-156. |
| Viewed | ||||||
|
Full text |
|
|||||
|
Abstract |
|
|||||