Clinical Focus ›› 2025, Vol. 40 ›› Issue (5): 417-422.doi: 10.3969/j.issn.1004-583X.2025.05.006
Previous Articles Next Articles
Analysis of risk factors for liver fibrosis in metabolic dysfunction-associated fatty liver disease and construction of a nomogram
Zhao Xueting1, Bai Jiawen1, Sun Jun2( )
)
- 1. Graduate School, Jinzhou Medical University, Jinzhou 121000, China
2. Department of Gastroenterology, Central Hospital of Jinzhou, Jinzhou 121000, China
-
Received:2024-12-16Online:2025-05-20Published:2025-05-23 -
Contact:Sun Jun E-mail:50681118@qq.com
CLC Number:
Cite this article
Zhao Xueting, Bai Jiawen, Sun Jun. Analysis of risk factors for liver fibrosis in metabolic dysfunction-associated fatty liver disease and construction of a nomogram[J]. Clinical Focus, 2025, 40(5): 417-422.
share this article
Add to citation manager EndNote|Ris|BibTeX
URL: http://www.lchc.cn/EN/10.3969/j.issn.1004-583X.2025.05.006
| 组别 | 例数 | 年龄 (岁) | 性别[例(%)] | BMI[例(%)] | 高血压病 [例(%)] | 吸烟史 [例(%)] | 饮酒史 [例(%)] | |||||||||||||||||
|---|---|---|---|---|---|---|---|---|---|---|---|---|---|---|---|---|---|---|---|---|---|---|---|---|
| 男性 | 女性 | 正常 | 超重 | 肥胖 | ||||||||||||||||||||
| 训练集 | 199 | 53(42,61) | 122.0(61.3) | 77.0(38.7) | 37(18.6) | 67(33.7) | 95(47.7) | 87(43.7) | 63(31.7) | 28(14.1) | ||||||||||||||
| 验证集 | 83 | 50(40,60) | 43.0(51.8) | 40.0(48.2) | 15(18.1) | 29(34.9) | 39(47.7) | 31(37.3) | 17(20.5) | 5(6.02) | ||||||||||||||
| χ2/Z值 | -0.502 | 2.177 | 0.043 | 0.976 | 3.600 | 3.670 | ||||||||||||||||||
| P值 | 0.615 | 0.140 | 0.979 | 0.323 | 0.058 | 0.055 | ||||||||||||||||||
| 组别 | HOMA-IR | FPG (mmol/L) | HbA1c (%) | UA (mmol/L) | WBC (×109/L) | PLT (×109/L) | PWR | ALB (g/L) | ALT (IU/L) | |||||||||||||||
| 训练集 | 7.86(4.4,13.8) | 9.88(7.10, 13.5) | 8.1(6.7, 9.6) | 367(300,453) | 7.5(6.14,9.05) | 231(200,275) | 28.98(24.62,36.9) | 45(42,47) | 44(27,78) | |||||||||||||||
| 验证集 | 5.83(4.27, 10.38) | 8.72(6.75, 12.76) | 7.8(6.4, 9.6) | 350(326,435) | 7.36(5.89,8.6) | 236(211,282) | 34.0(41.0,47.0) | 45(41,47) | 55(29,83) | |||||||||||||||
| χ2/Z值 | -1.938 | -1.345 | -0.944 | -0.004 | -1.122 | -0.863 | -2.351 | -0.438 | -0.758 | |||||||||||||||
| P值 | 0.053 | 0.179 | 0.345 | 0.997 | 0.262 | 0.388 | 0.072 | 0.628 | 0.448 | |||||||||||||||
| 组别 | AST (IU/L) | HCY (μmol/L) | GGT (IU/L) | ALP (IU/L) | TC (mmol/L) | TG (mmol/L) | HLD-C (mmol/L) | LDL-C (mmol/L) | ||||||||||||||||
| 训练集 | 30(22,62) | 12(9,17) | 55(36,88) | 82(66,95) | 5.24(4.28,6.22) | 2.27(1.53,3.91) | 1.11(0.98,1.33) | 3.27(2.60,3.93) | ||||||||||||||||
| 验证集 | 37(23,59) | 11(9,16) | 54(36,91) | 82(65,101) | 5.37(4.3,6.06) | 2.64(1.79,3.40) | 1.20(1.04,1.33) | 3.37(2.71,4.07) | ||||||||||||||||
| χ2/Z值 | -0.543 | -0.969 | -0.315 | -0.196 | -0.357 | -1.203 | -1.469 | -0.839 | ||||||||||||||||
| P值 | 0.587 | 0.333 | 0.753 | 0.844 | 0.753 | 0.229 | 0.142 | 0.402 | ||||||||||||||||
Tab.1 Comparison of baseline data between groups
| 组别 | 例数 | 年龄 (岁) | 性别[例(%)] | BMI[例(%)] | 高血压病 [例(%)] | 吸烟史 [例(%)] | 饮酒史 [例(%)] | |||||||||||||||||
|---|---|---|---|---|---|---|---|---|---|---|---|---|---|---|---|---|---|---|---|---|---|---|---|---|
| 男性 | 女性 | 正常 | 超重 | 肥胖 | ||||||||||||||||||||
| 训练集 | 199 | 53(42,61) | 122.0(61.3) | 77.0(38.7) | 37(18.6) | 67(33.7) | 95(47.7) | 87(43.7) | 63(31.7) | 28(14.1) | ||||||||||||||
| 验证集 | 83 | 50(40,60) | 43.0(51.8) | 40.0(48.2) | 15(18.1) | 29(34.9) | 39(47.7) | 31(37.3) | 17(20.5) | 5(6.02) | ||||||||||||||
| χ2/Z值 | -0.502 | 2.177 | 0.043 | 0.976 | 3.600 | 3.670 | ||||||||||||||||||
| P值 | 0.615 | 0.140 | 0.979 | 0.323 | 0.058 | 0.055 | ||||||||||||||||||
| 组别 | HOMA-IR | FPG (mmol/L) | HbA1c (%) | UA (mmol/L) | WBC (×109/L) | PLT (×109/L) | PWR | ALB (g/L) | ALT (IU/L) | |||||||||||||||
| 训练集 | 7.86(4.4,13.8) | 9.88(7.10, 13.5) | 8.1(6.7, 9.6) | 367(300,453) | 7.5(6.14,9.05) | 231(200,275) | 28.98(24.62,36.9) | 45(42,47) | 44(27,78) | |||||||||||||||
| 验证集 | 5.83(4.27, 10.38) | 8.72(6.75, 12.76) | 7.8(6.4, 9.6) | 350(326,435) | 7.36(5.89,8.6) | 236(211,282) | 34.0(41.0,47.0) | 45(41,47) | 55(29,83) | |||||||||||||||
| χ2/Z值 | -1.938 | -1.345 | -0.944 | -0.004 | -1.122 | -0.863 | -2.351 | -0.438 | -0.758 | |||||||||||||||
| P值 | 0.053 | 0.179 | 0.345 | 0.997 | 0.262 | 0.388 | 0.072 | 0.628 | 0.448 | |||||||||||||||
| 组别 | AST (IU/L) | HCY (μmol/L) | GGT (IU/L) | ALP (IU/L) | TC (mmol/L) | TG (mmol/L) | HLD-C (mmol/L) | LDL-C (mmol/L) | ||||||||||||||||
| 训练集 | 30(22,62) | 12(9,17) | 55(36,88) | 82(66,95) | 5.24(4.28,6.22) | 2.27(1.53,3.91) | 1.11(0.98,1.33) | 3.27(2.60,3.93) | ||||||||||||||||
| 验证集 | 37(23,59) | 11(9,16) | 54(36,91) | 82(65,101) | 5.37(4.3,6.06) | 2.64(1.79,3.40) | 1.20(1.04,1.33) | 3.37(2.71,4.07) | ||||||||||||||||
| χ2/Z值 | -0.543 | -0.969 | -0.315 | -0.196 | -0.357 | -1.203 | -1.469 | -0.839 | ||||||||||||||||
| P值 | 0.587 | 0.333 | 0.753 | 0.844 | 0.753 | 0.229 | 0.142 | 0.402 | ||||||||||||||||
| 变量 | 回归系数 | 标准误 | OR值 | 95%CI | Z值 | P值 | |
|---|---|---|---|---|---|---|---|
| 下限 | 上限 | ||||||
| 年龄 | -0.005 | 0.011 | 0.995 | 0.974 | 1.017 | -0.463 | 0.644 |
| 性别 | 0.137 | 0.305 | 1.146 | 0.631 | 2.084 | 0.447 | 0.655 |
| 高血压病 | 0.529 | 0.299 | 1.698 | 0.945 | 3.050 | 1.771 | 0.076 |
| 吸烟史 | 0.053 | 0.317 | 1.054 | 0.566 | 1.962 | 0.166 | 0.868 |
| 饮酒史 | 0.524 | 0.412 | 1.689 | 0.753 | 3.786 | 1.272 | 0.203 |
| BMI | 0.544 | 0.407 | 1.723 | 0.776 | 3.825 | 1.336 | 1.336 |
| PLT | -0.010 | 0.003 | 0.990 | 0.984 | 0.996 | -3.662 | <0.001 |
| WBC | 0.071 | 0.065 | 1.073 | 0.945 | 1.219 | 1.090 | 0.276 |
| PWR | -0.090 | 0.021 | 0.914 | 0.877 | 0.952 | -4.385 | <0.001 |
| ALB | -0.032 | 0.028 | 0.969 | 0.917 | 1.024 | -1.115 | 0.265 |
| ALP | 0.014 | 0.006 | 1.014 | 1.002 | 1.026 | 2.369 | 0.018 |
| ALT | 0.012 | 0.003 | 1.013 | 1.007 | 1.019 | 3.703 | <0.001 |
| AST | 0.022 | 0.005 | 1.023 | 1.013 | 1.033 | 4.550 | <0.001 |
| GGT | 0.009 | 0.003 | 1.009 | 1.003 | 1.015 | 2.867 | 0.004 |
| TC | -0.099 | 0.097 | 0.906 | 0.749 | 1.095 | -1.017 | 0.309 |
| TG | -0.025 | 0.037 | 0.975 | 0.907 | 1.049 | -0.667 | 0.505 |
| HDL-C | -0.753 | 0.464 | 0.471 | 0.190 | 1.169 | -1.624 | 0.104 |
| LDL-C | -0.054 | 0.142 | 0.947 | 0.717 | 1.251 | -0.380 | 0.704 |
| UA | 0.030 | 0.013 | 1.030 | 1.004 | 1.057 | 2.349 | 0.019 |
| HbA1c | 0.056 | 0.075 | 1.057 | 0.913 | 1.225 | 0.739 | 0.460 |
| FPG | 0.045 | 0.037 | 1.046 | 0.973 | 1.125 | 1.235 | 0.217 |
| HOMA-IR | 0.020 | 0.017 | 1.020 | 0.987 | 1.055 | 1.144 | 0.253 |
| HCY | 0.113 | 0.030 | 1.119 | 1.056 | 1.187 | 3.811 | <0.001 |
Tab.2 Univariate logistic regression analysis of the predictive factors for liver fibrosis in MAFLD patients
| 变量 | 回归系数 | 标准误 | OR值 | 95%CI | Z值 | P值 | |
|---|---|---|---|---|---|---|---|
| 下限 | 上限 | ||||||
| 年龄 | -0.005 | 0.011 | 0.995 | 0.974 | 1.017 | -0.463 | 0.644 |
| 性别 | 0.137 | 0.305 | 1.146 | 0.631 | 2.084 | 0.447 | 0.655 |
| 高血压病 | 0.529 | 0.299 | 1.698 | 0.945 | 3.050 | 1.771 | 0.076 |
| 吸烟史 | 0.053 | 0.317 | 1.054 | 0.566 | 1.962 | 0.166 | 0.868 |
| 饮酒史 | 0.524 | 0.412 | 1.689 | 0.753 | 3.786 | 1.272 | 0.203 |
| BMI | 0.544 | 0.407 | 1.723 | 0.776 | 3.825 | 1.336 | 1.336 |
| PLT | -0.010 | 0.003 | 0.990 | 0.984 | 0.996 | -3.662 | <0.001 |
| WBC | 0.071 | 0.065 | 1.073 | 0.945 | 1.219 | 1.090 | 0.276 |
| PWR | -0.090 | 0.021 | 0.914 | 0.877 | 0.952 | -4.385 | <0.001 |
| ALB | -0.032 | 0.028 | 0.969 | 0.917 | 1.024 | -1.115 | 0.265 |
| ALP | 0.014 | 0.006 | 1.014 | 1.002 | 1.026 | 2.369 | 0.018 |
| ALT | 0.012 | 0.003 | 1.013 | 1.007 | 1.019 | 3.703 | <0.001 |
| AST | 0.022 | 0.005 | 1.023 | 1.013 | 1.033 | 4.550 | <0.001 |
| GGT | 0.009 | 0.003 | 1.009 | 1.003 | 1.015 | 2.867 | 0.004 |
| TC | -0.099 | 0.097 | 0.906 | 0.749 | 1.095 | -1.017 | 0.309 |
| TG | -0.025 | 0.037 | 0.975 | 0.907 | 1.049 | -0.667 | 0.505 |
| HDL-C | -0.753 | 0.464 | 0.471 | 0.190 | 1.169 | -1.624 | 0.104 |
| LDL-C | -0.054 | 0.142 | 0.947 | 0.717 | 1.251 | -0.380 | 0.704 |
| UA | 0.030 | 0.013 | 1.030 | 1.004 | 1.057 | 2.349 | 0.019 |
| HbA1c | 0.056 | 0.075 | 1.057 | 0.913 | 1.225 | 0.739 | 0.460 |
| FPG | 0.045 | 0.037 | 1.046 | 0.973 | 1.125 | 1.235 | 0.217 |
| HOMA-IR | 0.020 | 0.017 | 1.020 | 0.987 | 1.055 | 1.144 | 0.253 |
| HCY | 0.113 | 0.030 | 1.119 | 1.056 | 1.187 | 3.811 | <0.001 |
| 变量 | 回归系数 | 标准误 | OR值 | 95%CI | Z值 | P值 | |
|---|---|---|---|---|---|---|---|
| 下限 | 上限 | ||||||
| PWR | -0.082 | 0.025 | 0.921 | 0.877 | 0.967 | -3.308 | <0.001 |
| AST | 0.021 | 0.005 | 1.021 | 1.011 | 1.031 | 3.760 | <0.001 |
| UA | 0.032 | 0.016 | 1.032 | 1.001 | 1.066 | 1.981 | 0.048 |
| HCY | 0.096 | 0.033 | 1.101 | 1.032 | 1.175 | 2.964 | 0.003 |
Tab.3 Multivariate logistic regression analysis of predictive factors for liver fibrosis in MAFLD patients
| 变量 | 回归系数 | 标准误 | OR值 | 95%CI | Z值 | P值 | |
|---|---|---|---|---|---|---|---|
| 下限 | 上限 | ||||||
| PWR | -0.082 | 0.025 | 0.921 | 0.877 | 0.967 | -3.308 | <0.001 |
| AST | 0.021 | 0.005 | 1.021 | 1.011 | 1.031 | 3.760 | <0.001 |
| UA | 0.032 | 0.016 | 1.032 | 1.001 | 1.066 | 1.981 | 0.048 |
| HCY | 0.096 | 0.033 | 1.101 | 1.032 | 1.175 | 2.964 | 0.003 |
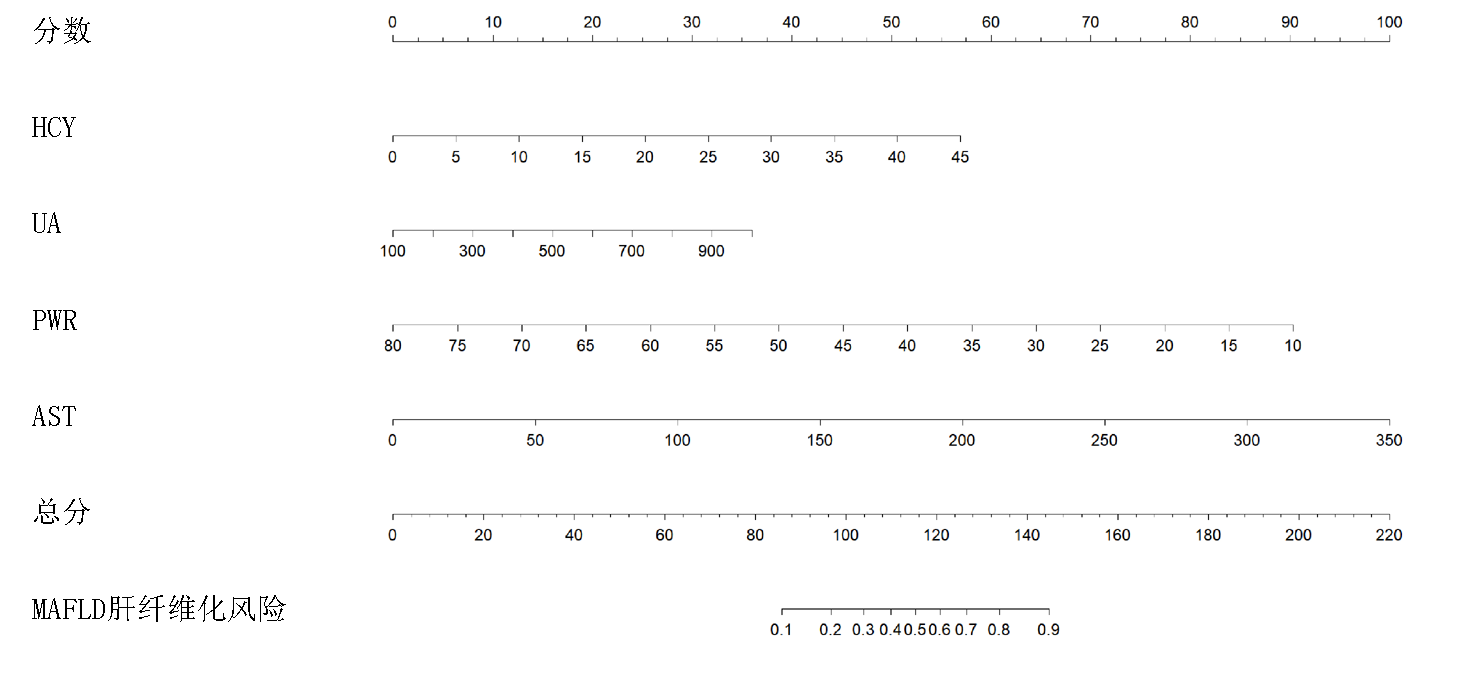
Fig.1 A nomogram for predicting liver fibrosis in MAFLD
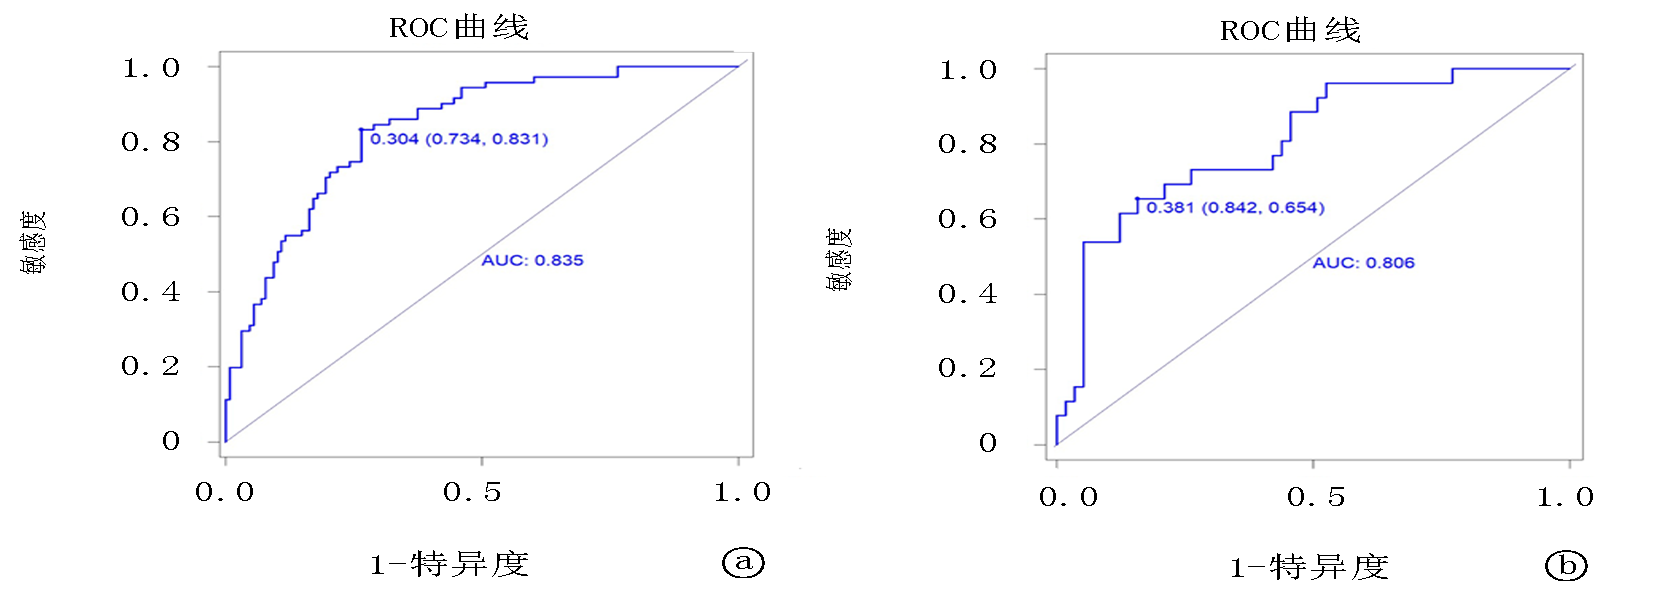
Fig.2 The ROC curve of the nomogram a. Training set; b. Validation set
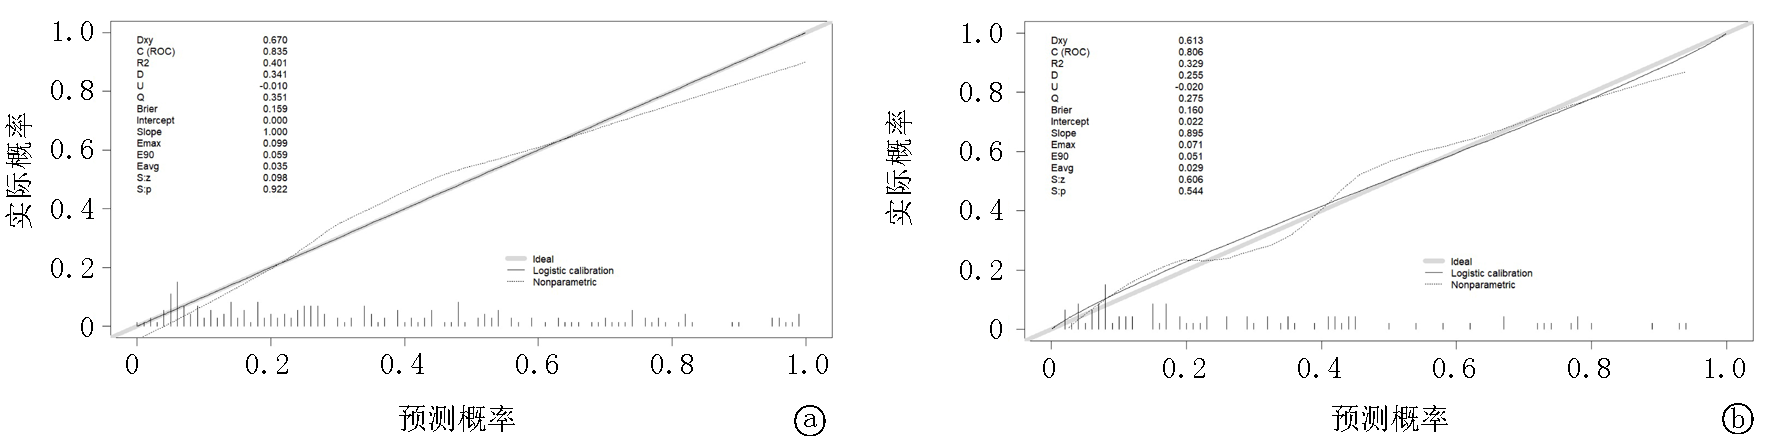
Fig.3 Calibration curve of the nomogram a. Training set; b. Validation set
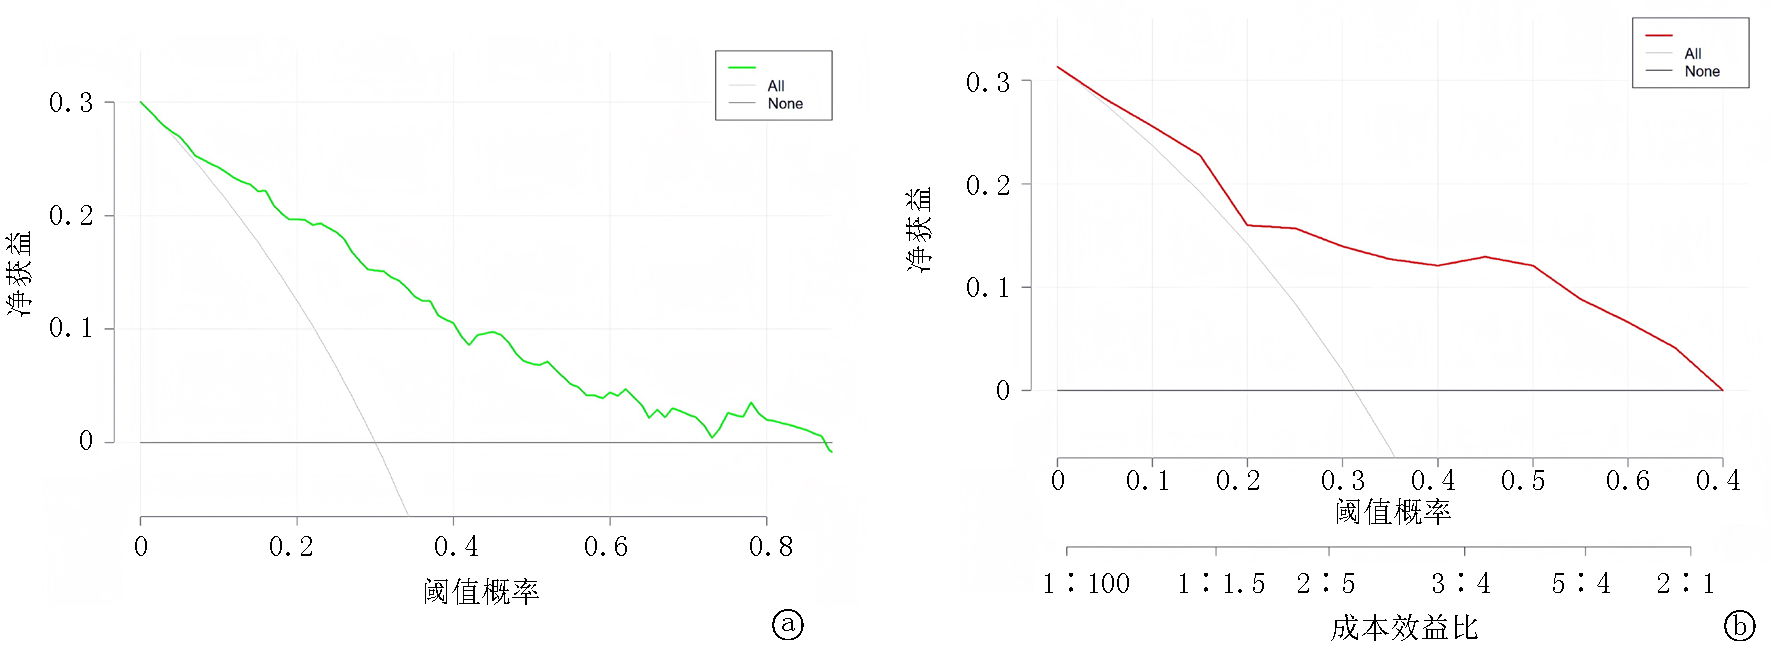
Fig.4 Decision curve analysis of the nomogram a. Training set; b. Validation set
| [1] | Lou TW, Yang RX, Fan JG. The global burden of fatty liver disease: The major impact of China[J]. Hepatobiliary Surg Nutr, 2024, 13(1):119-123. |
| [2] |
Cusi K, Isaacs S, Barb D, et al. American Association of Clinical Endocrinology clinical practice guideline for the diagnosis and management of nonalcoholic fatty liver disease in primary care and endocrinology clinical settings: Co-sponsored by the American Association for the Study of Liver Diseases (AASLD)[J]. Endocr Pract, 2022, 28(5):528-562.
doi: 10.1016/j.eprac.2022.03.010 pmid: 35569886 |
| [3] | Duell PB, Welty FK, Miller M, et al. Nonalcoholic fatty liver disease and cardiovascular risk: A scientific statement from the American Heart Association[J]. Arterioscler Thromb Vasc Biol, 2022, 42(6):168-185. |
| [4] | Sun DQ, Targher G, Byrne CD, et al. An international Delphi consensus statement on metabolic dysfunction-associated fatty liver disease and risk of chronic kidney disease[J]. Hepatobiliary Surg Nutr, 2023, 12(3):386-403. |
| [5] | Riazi K, Azhari H, Charette JH, et al. The prevalence and incidence of NAFLD worldwide: A systematic review and meta-analysis[J]. Lancet Gastroenterol Hepatol, 2022, 7(9):851-861. |
| [6] | 中华医学会肝病学分会. 代谢相关(非酒精性)脂肪性肝病防治指南(2024年版)[J]. 中华肝脏病杂志, 2024, 32(5):418-434. |
| [7] | 中华医学会肝病学分会, 中华医学会消化病学分会, 中华医学会感染病学分会. 肝纤维化诊断及治疗共识(2019年)[J]. 中华肝脏病杂志, 2019, 27(9):657-667. |
| [8] |
Younossi ZM, Anstee QM, Wong VWS, et al. The association of histologic and noninvasive tests with adverse clinical and patient-reported outcomes in patients with advanced fibrosis due to nonalcoholic steatohepatitis[J]. Gastroenterology, 2021, 160(5):1608-1619.
doi: 10.1053/j.gastro.2020.12.003 pmid: 33307033 |
| [9] | 中国肝炎防治基金会, 中华医学会感染病学分会, 中华医学会肝病学分会, 等. 瞬时弹性成像技术诊断肝纤维化专家共识(2018年更新版)[J]. 中华肝脏病杂志, 2019, 27(3):182-191. |
| [10] | Zhou J, Zhou F, Wang W, et al. Epidemiological features of NAFLDfrom 1999 to 2018 in China[J]. Hepatology, 2020, 71(5):1851-1864. |
| [11] | Hong T, Chen Y, Li X, et al. The role and mechanism of oxidative stress and nuclear receptors in the development of NAFLD[J]. Oxid Med Cell Longev, 2021, 2021(1): 6889533. |
| [12] |
Matsuda M, Seki E. Hepatic stellate cell-macrophage crosstalk in liver fibrosis and carcinogenesis[J]. Semin Liver Dis, 2020, 40(3):307-320.
doi: 10.1055/s-0040-1708876 pmid: 32242330 |
| [13] |
Chalasani N, Younossi Z, Lavine JE, et al. The diagnosis and management of nonalcoholic fatty liver disease: Practice guidance from the American Association for the Study of Liver Diseases[J]. Hepatology, 2018, 67(1):328-357.
doi: 10.1002/hep.29367 pmid: 28714183 |
| [14] |
Taylor RS, Taylor RJ, Bayliss S, et al. Association between fibrosis stage and outcomes of patients with nonalcoholic fatty liver disease: A systematic review and meta-analysis[J]. Gastroenterology, 2020, 158(6):1611-1625.
doi: S0016-5085(20)30137-2 pmid: 32027911 |
| [15] |
Younossi ZM, Stepanova M, Rafiq N, et al. Nonalcoholic steatofibrosis independently predicts mortality in nonalcoholic fatty liver disease[J]. Hepatol Commun, 2017, 1(5):421-428.
doi: 10.1002/hep4.1054 pmid: 29404470 |
| [16] |
Koupenova M, Livada AC, Morrell CN. Platelet and megakaryocyte roles in innate and adaptive immunity[J]. Circ Res, 2022, 130(2):288-308.
doi: 10.1161/CIRCRESAHA.121.319821 pmid: 35050690 |
| [17] | Zhou Y, Tian N, Li P, et al. The correlation between neutrophil-to-lymphocyte ratio and platelet-to-lymphocyte ratio with nonalcoholic fatty liver disease: A cross-sectional study[J]. Eur J Gastroenterol Hepatol, 2022, 34(11):1158-1164. |
| [18] | Ulloque-Badaracco JR, Hernandez-Bustamante EA, Alarcon-Braga EA, et al. Vitamin B12, folate, and homocysteine in metabolic syndrome: A systematic review and meta-analysis[J]. Front Endocrinol (Lausanne), 2023, 14: 1221259. |
| [19] |
Lv D, Wang Z, Ji S, et al. Plasma levels of homocysteine is associated with liver fibrosis in health check-up population[J]. Int J Gen Med, 2021, 14:5175-5181.
doi: 10.2147/IJGM.S329863 pmid: 34512000 |
| [20] | Duan H, Zhang R, Chen X, et al. Associations of uric acid with liver steatosis and fibrosis applying vibration controlled transient elastography in the united states: A nationwide cross-section study[J]. Front Endocrinol (Lausanne), 2022, 13: 930224. |
| [21] | Wang CY, Kao HH, Lai KY, et al. Clinical and metabolic characteristics of Hyperuricemia with risk of liver fibrosis: A cross-sectional study[J]. Metabolites, 2022, 12(10):893. |
| Viewed | ||||||
|
Full text |
|
|||||
|
Abstract |
|
|||||