Clinical Focus ›› 2025, Vol. 40 ›› Issue (5): 434-438.doi: 10.3969/j.issn.1004-583X.2025.05.009
Previous Articles Next Articles
The potential of hepcidin/serum ferritin ratio in assessing anemia in patients with maintenance peritoneal dialysis
Zhang Hongtao1, Zhong Meijiao1, Gao Jingyang1, Li Shijie1, Yu Naxin1, Fan Xin1, Chen Lining1, Zhang Yang1, Wang Zhikui2, Bian Aishu1( )
)
- 1. Department of Nephrology, Shenyang 242 Hospital, Shenyang 110034, China
2. Department of Nephrology, Linyi People's Hospital, Linyi 276002, China
-
Received:2024-08-06Online:2025-05-20Published:2025-05-23 -
Contact:Bian Aishu E-mail:13516006054@163.com
CLC Number:
Cite this article
Zhang Hongtao, Zhong Meijiao, Gao Jingyang, Li Shijie, Yu Naxin, Fan Xin, Chen Lining, Zhang Yang, Wang Zhikui, Bian Aishu. The potential of hepcidin/serum ferritin ratio in assessing anemia in patients with maintenance peritoneal dialysis[J]. Clinical Focus, 2025, 40(5): 434-438.
share this article
Add to citation manager EndNote|Ris|BibTeX
URL: http://www.lchc.cn/EN/10.3969/j.issn.1004-583X.2025.05.009
| 项目 | 非贫血组(n=108) | 贫血组(n=130) | t/Z值 | P值 |
|---|---|---|---|---|
| 透析龄(月) | 21.23±11.59 | 20.62±13.89 | 0.367 | 0.714 |
| 收缩压(mmHg) | 144.56±21.12 | 143.77±24.20 | 0.271 | 0.787 |
| PLT(×109/L) | 220.00±70.36 | 220.13±84.09 | -0.013 | 0.990 |
| RDW(fL) | 44.90±5.39 | 44.90±6.27 | 0.002 | 0.998 |
| ALB(g/L) | 36.39±7.12 | 34.73±6.61 | 1.861 | 0.044 |
| UCB(μmol/L) | 5.13±2.85 | 4.63±2.42 | 1.470 | 0.143 |
| ALP(U/L) | 89.30±50.03 | 85.76±48.37 | 0.551 | 0.582 |
| PAB(mg/L) | 30.68±8.72 | 32.01±9.97 | -0.790 | 0.431 |
| BUN(mmol/L) | 23.44±7.00 | 25.25±7.60 | -1.884 | 0.061 |
| UA(μmol/L) | 396.38±98.40 | 404.54±115.71 | -0.580 | 0.563 |
| TC(mmol/L) | 4.93±1.34 | 4.68±1.39 | 1.410 | 0.160 |
| LDL-C(mmol/L) | 3.07±1.04 | 2.92±1.01 | 1.090 | 0.277 |
| K+(mmol/L) | 4.37±0.82 | 4.37±0.69 | 0.092 | 0.927 |
| CO2(mmol/L) | 23.87±4.22 | 23.81±4.02 | 0.122 | 0.903 |
| P(mmol/L) | 1.77±0.61 | 1.89±0.52 | -1.619 | 0.107 |
| 总CCr(ml/min) | 66.80±27.14 | 62.96±17.67 | 0.734 | 0.465 |
| 腹膜CCr(ml/min) | 38.01±16.34 | 42.75±16.94 | -1.250 | 0.215 |
| NE(×109/L) | 4.6(3.5, 6.4) | 4.5(3.6, 6.3) | -0.080 | 0.936 |
| CB(μmol/L) | 2.0(1.4, 2.7) | 1.7(1.3, 2.4) | -1.924 | 0.054 |
| AST(U/L) | 16.3(11.8, 21.1) | 15.1(11.7, 21.3) | -0.462 | 0.644 |
| ALT(U/L) | 12.0(8.4, 17.8) | 11.1(7.2, 18.1) | -0.912 | 0.362 |
| FPG(mmol/L) | 5.6(5.0, 6.6) | 5.4(4.8, 7.1) | -0.364 | 0.716 |
| TG(mmol/L) | 1.3(0.9, 1.9) | 1.2(0.8, 1.6) | -1.701 | 0.089 |
| PTH(ng/L) | 192.8(93.7, 385.0) | 253.9(133.6, 480.9) | -1.857 | 0.063 |
| HEP(μg/L) | 79.80±7.58 | 112.33±32.12 | -11.181 | 0.020 |
| SF(μg/L) | 240.52±68.74 | 120.67±71.86 | 13.063 | 0.038 |
| HEP/SF比值 | 0.37±0.14 | 1.45±1.05 | -11.612 | 0.041 |
Tab.1 Comparison of laboratory tests between groups
| 项目 | 非贫血组(n=108) | 贫血组(n=130) | t/Z值 | P值 |
|---|---|---|---|---|
| 透析龄(月) | 21.23±11.59 | 20.62±13.89 | 0.367 | 0.714 |
| 收缩压(mmHg) | 144.56±21.12 | 143.77±24.20 | 0.271 | 0.787 |
| PLT(×109/L) | 220.00±70.36 | 220.13±84.09 | -0.013 | 0.990 |
| RDW(fL) | 44.90±5.39 | 44.90±6.27 | 0.002 | 0.998 |
| ALB(g/L) | 36.39±7.12 | 34.73±6.61 | 1.861 | 0.044 |
| UCB(μmol/L) | 5.13±2.85 | 4.63±2.42 | 1.470 | 0.143 |
| ALP(U/L) | 89.30±50.03 | 85.76±48.37 | 0.551 | 0.582 |
| PAB(mg/L) | 30.68±8.72 | 32.01±9.97 | -0.790 | 0.431 |
| BUN(mmol/L) | 23.44±7.00 | 25.25±7.60 | -1.884 | 0.061 |
| UA(μmol/L) | 396.38±98.40 | 404.54±115.71 | -0.580 | 0.563 |
| TC(mmol/L) | 4.93±1.34 | 4.68±1.39 | 1.410 | 0.160 |
| LDL-C(mmol/L) | 3.07±1.04 | 2.92±1.01 | 1.090 | 0.277 |
| K+(mmol/L) | 4.37±0.82 | 4.37±0.69 | 0.092 | 0.927 |
| CO2(mmol/L) | 23.87±4.22 | 23.81±4.02 | 0.122 | 0.903 |
| P(mmol/L) | 1.77±0.61 | 1.89±0.52 | -1.619 | 0.107 |
| 总CCr(ml/min) | 66.80±27.14 | 62.96±17.67 | 0.734 | 0.465 |
| 腹膜CCr(ml/min) | 38.01±16.34 | 42.75±16.94 | -1.250 | 0.215 |
| NE(×109/L) | 4.6(3.5, 6.4) | 4.5(3.6, 6.3) | -0.080 | 0.936 |
| CB(μmol/L) | 2.0(1.4, 2.7) | 1.7(1.3, 2.4) | -1.924 | 0.054 |
| AST(U/L) | 16.3(11.8, 21.1) | 15.1(11.7, 21.3) | -0.462 | 0.644 |
| ALT(U/L) | 12.0(8.4, 17.8) | 11.1(7.2, 18.1) | -0.912 | 0.362 |
| FPG(mmol/L) | 5.6(5.0, 6.6) | 5.4(4.8, 7.1) | -0.364 | 0.716 |
| TG(mmol/L) | 1.3(0.9, 1.9) | 1.2(0.8, 1.6) | -1.701 | 0.089 |
| PTH(ng/L) | 192.8(93.7, 385.0) | 253.9(133.6, 480.9) | -1.857 | 0.063 |
| HEP(μg/L) | 79.80±7.58 | 112.33±32.12 | -11.181 | 0.020 |
| SF(μg/L) | 240.52±68.74 | 120.67±71.86 | 13.063 | 0.038 |
| HEP/SF比值 | 0.37±0.14 | 1.45±1.05 | -11.612 | 0.041 |
| 变量 | 回归系数 | 标准误 | Wald χ2值 | P值 | OR值 | 95%CI |
|---|---|---|---|---|---|---|
| HEP | 0.052 | 0.007 | 54.087 | 0.040 | 1.053 | 1.039~1.068 |
| SF | -0.022 | 0.003 | 63.590 | 0.021 | 0.979 | 0.973~0.984 |
| HEP/SF比值 | 6.632 | 0.956 | 48.102 | 0.039 | 759.118 | 116.505~4 946.210 |
Tab.2 Logistics regression analysis of risk factors for renal anemia in PD patients
| 变量 | 回归系数 | 标准误 | Wald χ2值 | P值 | OR值 | 95%CI |
|---|---|---|---|---|---|---|
| HEP | 0.052 | 0.007 | 54.087 | 0.040 | 1.053 | 1.039~1.068 |
| SF | -0.022 | 0.003 | 63.590 | 0.021 | 0.979 | 0.973~0.984 |
| HEP/SF比值 | 6.632 | 0.956 | 48.102 | 0.039 | 759.118 | 116.505~4 946.210 |
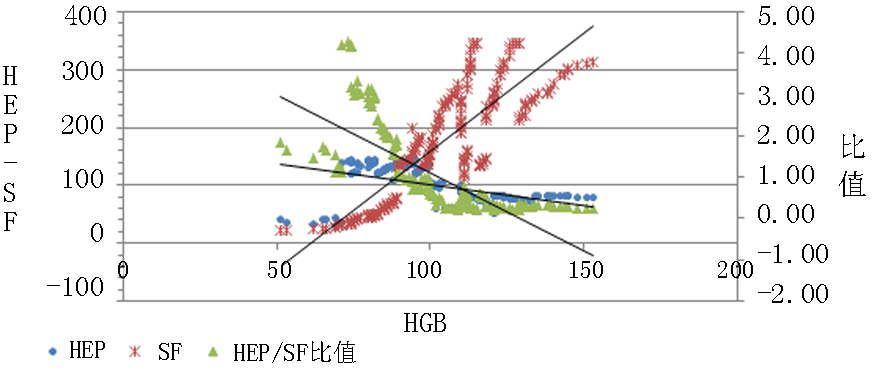
Fig.1 The scatter plot of the correlation of HGB with HEP, SF and HEP/SF ratio
| 项目 | 平均值 | 标准差 | HGB | HEP | SF | HEP/SF比值 |
|---|---|---|---|---|---|---|
| HGB | 103.845 | 19.133 | 1 | |||
| HEP | 97.567 | 29.169 | -0.468* | 1 | ||
| SF | 175.053 | 92.301 | 0.840* | -0.477* | 1 | |
| HEP/SF比值 | 0.960 | 0.951 | -0.760* | 0.608* | -0.806* | 1 |
Tab.3 Pearson correlation analysis of HGB with HEP, SF and HEP/SF ratio
| 项目 | 平均值 | 标准差 | HGB | HEP | SF | HEP/SF比值 |
|---|---|---|---|---|---|---|
| HGB | 103.845 | 19.133 | 1 | |||
| HEP | 97.567 | 29.169 | -0.468* | 1 | ||
| SF | 175.053 | 92.301 | 0.840* | -0.477* | 1 | |
| HEP/SF比值 | 0.960 | 0.951 | -0.760* | 0.608* | -0.806* | 1 |
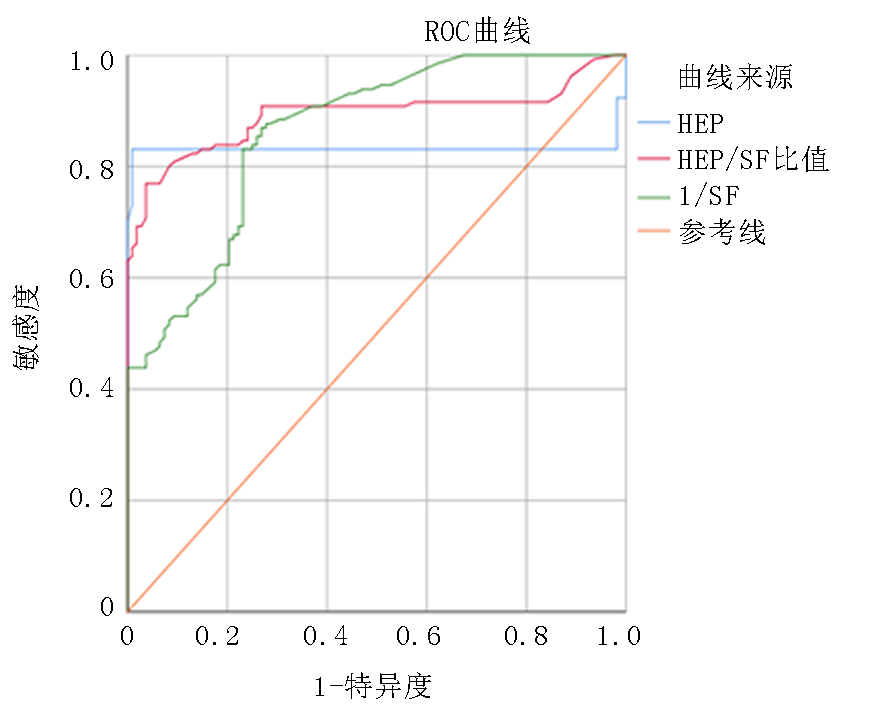
Fig.2 ROC curve of HEP, SF and HEP/SF ratio in predicting anemia in PD patients
| 预测项目 | AUC | 标准误 | P值 | 95%CI | 敏感度 | 特异度 | 界值 | |
|---|---|---|---|---|---|---|---|---|
| 下限 | 上限 | |||||||
| HEP | 0.831 | 0.033 | <0.05 | 0.768 | 0.895 | 0.731 | 0.881 | 0.822 |
| HEP/SF比值 | 0.892 | 0.023 | <0.05 | 0.846 | 0.937 | 0.769 | 0.963 | 0.732 |
| SF | 0.862 | 0.023 | <0.05 | 0.817 | 0.907 | 0.869 | 0.731 | 0.601 |
Tab.4 The predictive value of HEP, SF and HEP/SF for renal anemia
| 预测项目 | AUC | 标准误 | P值 | 95%CI | 敏感度 | 特异度 | 界值 | |
|---|---|---|---|---|---|---|---|---|
| 下限 | 上限 | |||||||
| HEP | 0.831 | 0.033 | <0.05 | 0.768 | 0.895 | 0.731 | 0.881 | 0.822 |
| HEP/SF比值 | 0.892 | 0.023 | <0.05 | 0.846 | 0.937 | 0.769 | 0.963 | 0.732 |
| SF | 0.862 | 0.023 | <0.05 | 0.817 | 0.907 | 0.869 | 0.731 | 0.601 |
| [1] | Costa E, Pereira BJ, Rocha-Pereira P, et al. Hepcidin as a predictor of response to iron therapy in peritoneal dialysis patients[J]. Nephrology, 2015, 20(8):534-540. |
| [2] | 中国医师协会肾脏内科医师分会肾性贫血指南工作组. 中国肾性贫血诊治临床实践指南[J]. 中华医学杂志, 2021, 101(20):1463-1502. |
| [3] | 王祎星, 马红珍. 肾性贫血的发生机制与治疗研究进展[J]. 浙江医学, 2018, 40(5):537-540. |
| [4] |
Hanna RM, Streja E, Kalantar-Zadeh K. Burden of anemia in chronic kidney disease: Beyond erythropoietin[J]. Adv Ther, 2021, 38(1):52-75.
doi: 10.1007/s12325-020-01524-6 pmid: 33123967 |
| [5] |
刘颖, 林洪丽. 慢性肾脏病贫血与炎症[J]. 中国实用内科杂志, 2020, 40(11):908-911.
doi: 10.19538/j.nk2020110107 |
| [6] |
Babitt JL, Eisenga MF, Haase VH, et al. Controversies in optimal anemia management: Conclusions from a kidney disease: Improving global outcomes (KDIGO) conference[J]. Kidney Int, 2021, 99(6):1280-1295.
doi: 10.1016/j.kint.2021.03.020 pmid: 33839163 |
| [7] | Schömig M, Eisenhardt A, Ritz E. The microinflammatory state of uremia[J]. Blood Purif, 2000, 18(4):327-332. |
| [8] | Arosio P. New advances in iron metabolism, ferritin and hepcidin research[J]. Int J Mol Sci, 2022, 23(23):14700. |
| [9] | Tarancon-Diez L, Genebat M, Roman-Enry M, et al. Threshold ferritin concentrations reflecting early iron deficiency based on hepcidin and soluble transferrin receptor serum levels in patients with absolute iron deficiency[J]. Nutrients, 2022, 14(22):4739. |
| [10] | 米海潮, 崔芳, 杜玉涛, 等. 慢性病贫血铁代谢调节机制的研究进展[J]. 生理学报, 2022, 74(4):639-647. |
| [11] | Nemeth E, Ganz T. Hepcidin and iron in health and disease[J]. Annu Rev Med, 2023, 74:261-277. |
| [12] | 张泽宇, 尹良红. 缺氧诱导因子调节铁调素在肾性贫血中的研究进展[J]. 中国病理生理杂志, 2021, 37(3):558-564. |
| [13] |
Prabhu MV, Nayak A, Sridhar G, et al. Maximizing the erythropoietin response: Iron strategies[J]. Contrib Nephrol, 2012, 178:95-99.
doi: 10.1159/000337820 pmid: 22652723 |
| [14] | 鲍美霜, 王洁, 肖宇, 等. Hepcidin/SF比值在维持性腹膜透析患者中的临床价值分析[J]. 右江民族医学院学报, 2021, 43(6):751-756. |
| [15] | 滑瑞雪, 邹陆曦, 吴雨, 等. 透析液葡萄糖对维持性血液透析患者血清铁调素合成的影响[J]. 临床肾脏病杂志, 2022, 22(5):359-364. |
| Viewed | ||||||
|
Full text |
|
|||||
|
Abstract |
|
|||||