Clinical Focus ›› 2025, Vol. 40 ›› Issue (8): 711-716.doi: 10.3969/j.issn.1004-583X.2025.08.007
Previous Articles Next Articles
Value of texture analysis of histograms of energy spectrum CT images in differentiating bone islands from osteoblastic bone metastases
Wang Bohuan1, Huang Junbin1, Li Zhiqiong1, Xiong Yuchao1, Guo Wei2, Zeng Xuwen1( )
)
- 1. Department of Radiology, Guangzhou Red Cross Hospital (Guangzhou Red Cross Hospital Affiliated to Jinan University), Guangzhou 510220, China
2. Department of Radiology, the Third Hospital of Wuhan City (Tongren Hospital of Wuhan University), Wuhan 430000, China
-
Received:2025-04-28Online:2025-08-20Published:2025-09-05 -
Contact:Zeng Xuwen E-mail:gzshszhyyfsk@163.com
CLC Number:
Cite this article
Wang Bohuan, Huang Junbin, Li Zhiqiong, Xiong Yuchao, Guo Wei, Zeng Xuwen. Value of texture analysis of histograms of energy spectrum CT images in differentiating bone islands from osteoblastic bone metastases[J]. Clinical Focus, 2025, 40(8): 711-716.
share this article
Add to citation manager EndNote|Ris|BibTeX
URL: https://www.lchc.cn/EN/10.3969/j.issn.1004-583X.2025.08.007
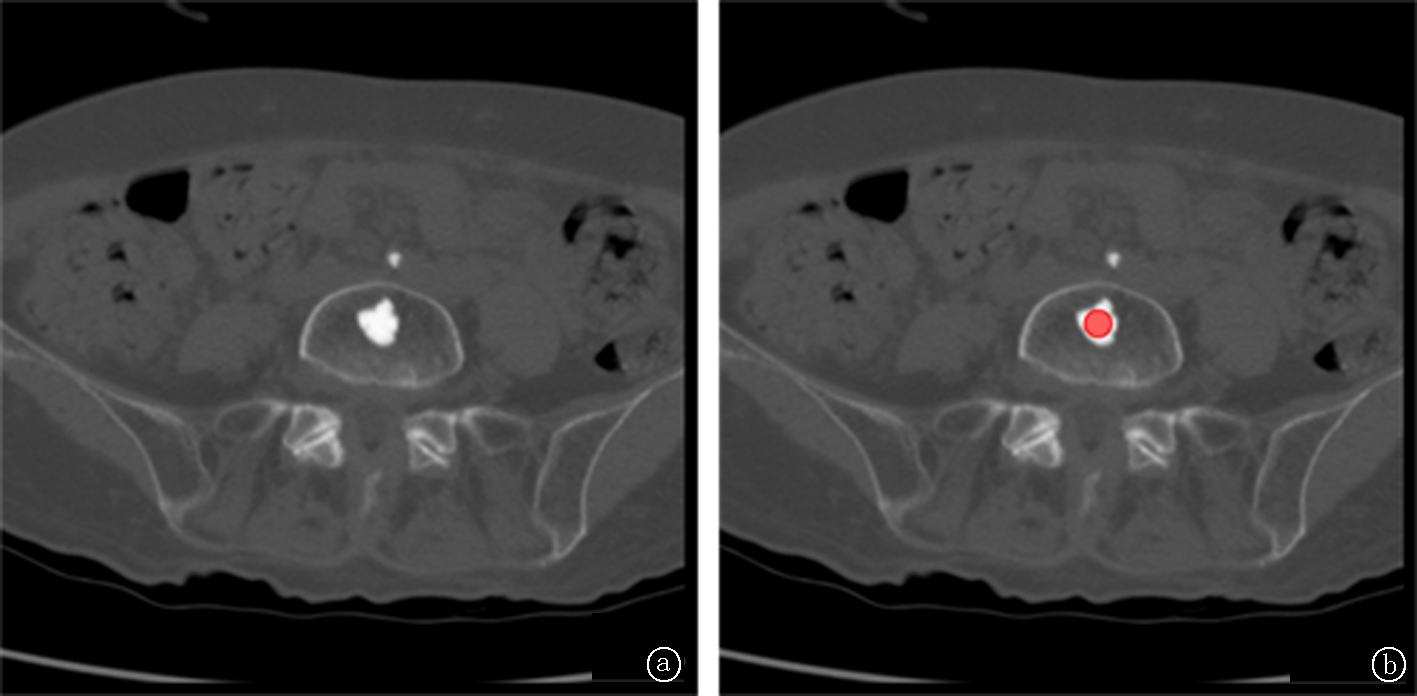
Fig.1 A 65-year-old male with a BI in the L5 vertebra a. the maximum layer of the lesion; b. the schematic diagram of ROI delineation of the lesion
| 组别 | 例数 | 病灶数 | 男性[例(%)] | 年龄(岁) | 单发[例(%)] | ROI大小(cm2) |
|---|---|---|---|---|---|---|
| BI组 | 81 | 125 | 43(53.1) | 65.56±12.74 | 54(66.7) | 18.75±13.53 |
| OBM组 | 13 | 91 | 5(38.5) | 67.15±6.50 | 3(23.1) | 65.16±51.12 |
| 统计值 | χ2=0.959 | t=0.442 | χ2=8.948 | t=58.437 | ||
| P值 | 0.381 | 0.660 | 0.003 | 0.001 |
Tab.1 Basic information between the two groups
| 组别 | 例数 | 病灶数 | 男性[例(%)] | 年龄(岁) | 单发[例(%)] | ROI大小(cm2) |
|---|---|---|---|---|---|---|
| BI组 | 81 | 125 | 43(53.1) | 65.56±12.74 | 54(66.7) | 18.75±13.53 |
| OBM组 | 13 | 91 | 5(38.5) | 67.15±6.50 | 3(23.1) | 65.16±51.12 |
| 统计值 | χ2=0.959 | t=0.442 | χ2=8.948 | t=58.437 | ||
| P值 | 0.381 | 0.660 | 0.003 | 0.001 |
| 组别 | 例数 | 传统图像 | 40 keV | 60 keV | 80 keV | 100 keV | |||||
|---|---|---|---|---|---|---|---|---|---|---|---|
| BI组 | 81 | 1 166(1 068,1 244) | 2 686(2 466,2 884) | 1 471(1 326,1 566) | 1 027(924,1 090) | 830(740,888) | |||||
| OBM组 | 13 | 892(661,1 028) | 2 087(1 550,2 451) | 1 144(841,1 335) | 804(584,943) | 662(476,768) | |||||
| Z值 | 21.663 | 35.466 | 22.971 | 21.065 | 18.917 | ||||||
| P值 | <0.001 | <0.001 | <0.001 | <0.001 | <0.001 | ||||||
| 组别 | 120 keV | 140 keV | 160 keV | 180 keV | 200 keV | ||||||
| BI组 | 734(655,790) | 679(606,741) | 648(579,709) | 627(560,687) | 610(548,671) | ||||||
| OBM组 | 591(422,686) | 549(393,638) | 524(375,609) | 509(364,592) | 498(356,578) | ||||||
| Z值 | 17.115 | 15.859 | 15.005 | 14.405 | 13.948 | ||||||
| P值 | <0.001 | <0.001 | <0.001 | <0.001 | <0.001 | ||||||
Tab.2 Average single energy values between the two groups
| 组别 | 例数 | 传统图像 | 40 keV | 60 keV | 80 keV | 100 keV | |||||
|---|---|---|---|---|---|---|---|---|---|---|---|
| BI组 | 81 | 1 166(1 068,1 244) | 2 686(2 466,2 884) | 1 471(1 326,1 566) | 1 027(924,1 090) | 830(740,888) | |||||
| OBM组 | 13 | 892(661,1 028) | 2 087(1 550,2 451) | 1 144(841,1 335) | 804(584,943) | 662(476,768) | |||||
| Z值 | 21.663 | 35.466 | 22.971 | 21.065 | 18.917 | ||||||
| P值 | <0.001 | <0.001 | <0.001 | <0.001 | <0.001 | ||||||
| 组别 | 120 keV | 140 keV | 160 keV | 180 keV | 200 keV | ||||||
| BI组 | 734(655,790) | 679(606,741) | 648(579,709) | 627(560,687) | 610(548,671) | ||||||
| OBM组 | 591(422,686) | 549(393,638) | 524(375,609) | 509(364,592) | 498(356,578) | ||||||
| Z值 | 17.115 | 15.859 | 15.005 | 14.405 | 13.948 | ||||||
| P值 | <0.001 | <0.001 | <0.001 | <0.001 | <0.001 | ||||||
| 组别 | 例数 | 传统图像 | 40 keV | 60 keV | 80 keV | 100 keV | |||||
|---|---|---|---|---|---|---|---|---|---|---|---|
| BI组 | 81 | 4.30(4.11,4.50) | 3.94(2.92,4.36) | 4.30(4.11,4.50) | 4.22(4.04,4.42) | 4.20(4.01,4.42) | |||||
| OBM组 | 13 | 5.12(4.80,5.65) | 5.49(4.99,6.05) | 5.27(4.89,5.72) | 5.03(4.66,5.53) | 4.96(4.67,5.34) | |||||
| Z值 | 15.009 | 4.467 | 14.252 | 17.437 | 13.065 | ||||||
| P值 | <0.001 | 0.036 | <0.001 | <0.001 | <0.001 | ||||||
| 组别 | 120 keV | 140 keV | 160 keV | 180 keV | 200 keV | ||||||
| BI组 | 4.20(4.02,4.42) | 4.17(4.01,4.36) | 4.16(4.00,4.38) | 4.17(3.97,4.33) | 4.11(3.94,4.33) | ||||||
| OBM组 | 4.89(4.59,5.35) | 4.80(4.47,5.27) | 4.85(4.54,5.26) | 4.77(4.48,5.27) | 4.74(4.52,5.23) | ||||||
| Z值 | 15.086 | 16.862 | 14.758 | 17.174 | 17.533 | ||||||
| P值 | <0.001 | <0.001 | <0.001 | <0.001 | <0.001 | ||||||
Tab.3 Entropy of single energy between the two groups
| 组别 | 例数 | 传统图像 | 40 keV | 60 keV | 80 keV | 100 keV | |||||
|---|---|---|---|---|---|---|---|---|---|---|---|
| BI组 | 81 | 4.30(4.11,4.50) | 3.94(2.92,4.36) | 4.30(4.11,4.50) | 4.22(4.04,4.42) | 4.20(4.01,4.42) | |||||
| OBM组 | 13 | 5.12(4.80,5.65) | 5.49(4.99,6.05) | 5.27(4.89,5.72) | 5.03(4.66,5.53) | 4.96(4.67,5.34) | |||||
| Z值 | 15.009 | 4.467 | 14.252 | 17.437 | 13.065 | ||||||
| P值 | <0.001 | 0.036 | <0.001 | <0.001 | <0.001 | ||||||
| 组别 | 120 keV | 140 keV | 160 keV | 180 keV | 200 keV | ||||||
| BI组 | 4.20(4.02,4.42) | 4.17(4.01,4.36) | 4.16(4.00,4.38) | 4.17(3.97,4.33) | 4.11(3.94,4.33) | ||||||
| OBM组 | 4.89(4.59,5.35) | 4.80(4.47,5.27) | 4.85(4.54,5.26) | 4.77(4.48,5.27) | 4.74(4.52,5.23) | ||||||
| Z值 | 15.086 | 16.862 | 14.758 | 17.174 | 17.533 | ||||||
| P值 | <0.001 | <0.001 | <0.001 | <0.001 | <0.001 | ||||||
| 组别 | 例数 | 传统图像 | 40 keV | 60 keV | 80 keV | 100 keV | |||||
|---|---|---|---|---|---|---|---|---|---|---|---|
| BI组 | 81 | 1 360(1 274,1 420) | 3 071(2 914,3 017) | 1 715(1 606,1 799) | 1 185(1 127,1 258) | 967(916,1 032) | |||||
| OBM组 | 13 | 1 093(869,1 230) | 2 602(2 012,2 868) | 1 437(1 103,1 582) | 1 007(783,1 112) | 833(643,916) | |||||
| Z值 | 23.549 | 62.029 | 26.969 | 25.786 | 23.221 | ||||||
| P值 | <0.001 | <0.001 | <0.001 | <0.001 | <0.001 | ||||||
| 组别 | 120 keV | 140 keV | 160 keV | 180 keV | 200 keV | ||||||
| BI组 | 865(805,922) | 805(749,865) | 769(715,829) | 744(691,807) | 729(674,791) | ||||||
| OBM组 | 735(571,816) | 687(535,760) | 664(513,728) | 649(499,708) | 639(489,694) | ||||||
| Z值 | 20.331 | 18.375 | 17.005 | 15.999 | 15.375 | ||||||
| P值 | <0.001 | <0.001 | <0.001 | <0.001 | <0.001 | ||||||
Tab.4 Maximum single energy values between the two groups
| 组别 | 例数 | 传统图像 | 40 keV | 60 keV | 80 keV | 100 keV | |||||
|---|---|---|---|---|---|---|---|---|---|---|---|
| BI组 | 81 | 1 360(1 274,1 420) | 3 071(2 914,3 017) | 1 715(1 606,1 799) | 1 185(1 127,1 258) | 967(916,1 032) | |||||
| OBM组 | 13 | 1 093(869,1 230) | 2 602(2 012,2 868) | 1 437(1 103,1 582) | 1 007(783,1 112) | 833(643,916) | |||||
| Z值 | 23.549 | 62.029 | 26.969 | 25.786 | 23.221 | ||||||
| P值 | <0.001 | <0.001 | <0.001 | <0.001 | <0.001 | ||||||
| 组别 | 120 keV | 140 keV | 160 keV | 180 keV | 200 keV | ||||||
| BI组 | 865(805,922) | 805(749,865) | 769(715,829) | 744(691,807) | 729(674,791) | ||||||
| OBM组 | 735(571,816) | 687(535,760) | 664(513,728) | 649(499,708) | 639(489,694) | ||||||
| Z值 | 20.331 | 18.375 | 17.005 | 15.999 | 15.375 | ||||||
| P值 | <0.001 | <0.001 | <0.001 | <0.001 | <0.001 | ||||||
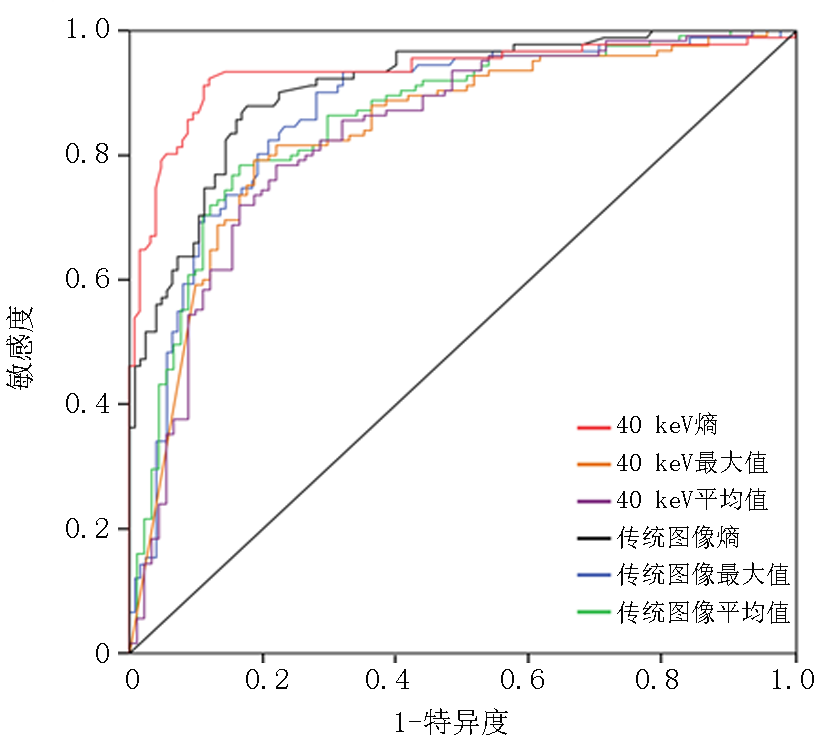
Fig.2 ROC curve of 40 keV and traditional image
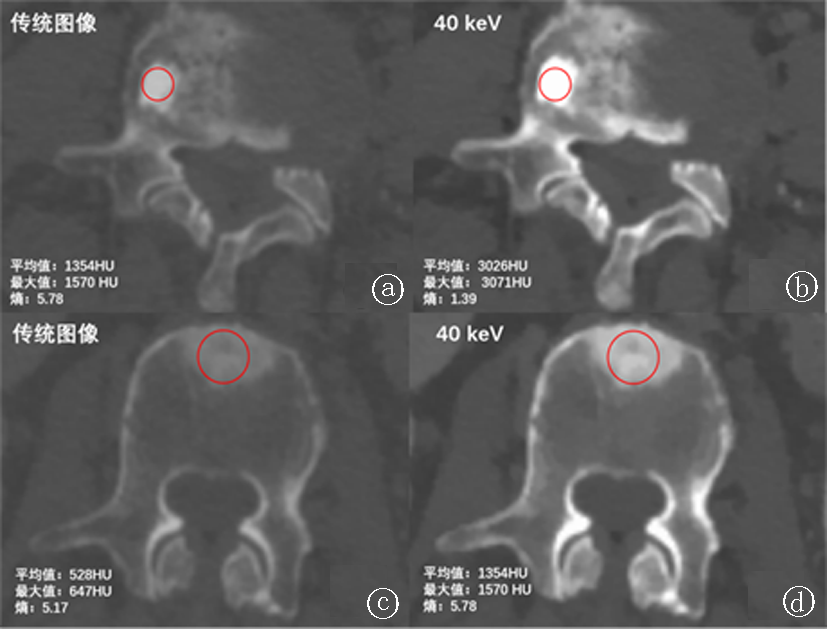
Fig.3 Comparison of entropy values of 40 keV and traditional image texture parameters a and b. A 87-year-old female with a BI in the L3 vertebra; c and d. A 71-year-old male with primary gastric cancer OBM at L3 vertebra
| 参数 | AUC | 95%CI | 截断值 | 敏感度(%) | 特异度(%) | 标准误 | P值 | |
|---|---|---|---|---|---|---|---|---|
| 下限 | 上限 | |||||||
| 40 keV | ||||||||
| 熵 | 0.934 | 0.895 | 0.973 | 4.593 | 92.3 | 88.0 | 0.923 | <0.001 |
| 均数 | 0.833 | 0.776 | 0.890 | 2 454 | 78.4 | 78.0 | 0.792 | <0.001 |
| 最大值 | 0.838 | 0.783 | 0.892 | 2 893 | 79.2 | 81.3 | 0.784 | <0.001 |
| 传统图像 | ||||||||
| 熵 | 0.910 | 0.872 | 0.949 | 4.632 | 87.9 | 82.4 | 0.879 | <0.001 |
| 均数 | 0.857 | 0.806 | 0.909 | 1 051 | 78.4 | 83.5 | 0.72 | <0.001 |
| 最大值 | 0.869 | 0.819 | 0.918 | 1 301 | 72.0 | 90.1 | 0.784 | <0.001 |
Tab.5 Efficacy of entropy, mean, and maximum values of 40 keV and traditional image texture parameters in distinguishing OBM from BI
| 参数 | AUC | 95%CI | 截断值 | 敏感度(%) | 特异度(%) | 标准误 | P值 | |
|---|---|---|---|---|---|---|---|---|
| 下限 | 上限 | |||||||
| 40 keV | ||||||||
| 熵 | 0.934 | 0.895 | 0.973 | 4.593 | 92.3 | 88.0 | 0.923 | <0.001 |
| 均数 | 0.833 | 0.776 | 0.890 | 2 454 | 78.4 | 78.0 | 0.792 | <0.001 |
| 最大值 | 0.838 | 0.783 | 0.892 | 2 893 | 79.2 | 81.3 | 0.784 | <0.001 |
| 传统图像 | ||||||||
| 熵 | 0.910 | 0.872 | 0.949 | 4.632 | 87.9 | 82.4 | 0.879 | <0.001 |
| 均数 | 0.857 | 0.806 | 0.909 | 1 051 | 78.4 | 83.5 | 0.72 | <0.001 |
| 最大值 | 0.869 | 0.819 | 0.918 | 1 301 | 72.0 | 90.1 | 0.784 | <0.001 |
| [1] |
Piccioli A, Maccauro G, Spinelli MS, et al. Bone metastases of unknown origin:Epidemiology and principles of management[J]. J Orthop Traumatol, 2015, 16(2):81-86.
doi: 10.1007/s10195-015-0344-0 pmid: 25726410 |
| [2] | 殷国良, 潘诗农. 骨转移瘤的影像学研究进展[J]. 现代肿瘤医学, 2020, 28(11):1977-1980. |
| [3] |
Kelly BS, Judge C, Bollard SM, et al. Radiology artificial intelligence: A systematic review and evaluation of methods (RAISE)[J]. Eur Radiol, 2022, 32(11):7998-8007.
doi: 10.1007/s00330-022-08784-6 pmid: 35420305 |
| [4] |
Xiong Y, Guo W, Liang Z, et al. Deep learning-based diagnosis of osteoblastic bone metastases and bone islands in computed tomograph images: A multicenter diagnostic study[J]. Eur Radiol, 2023, 33(9):6359-6368.
doi: 10.1007/s00330-023-09573-5 pmid: 37060446 |
| [5] | So A, Nicolaou S. Spectral computed tomography: Fundamental principles and recent developments[J]. Korean J Radiol, 2021, 22(1):86-96. |
| [6] | Greffier J, Villani N, Defez D, et al. Spectral CT imaging: Technical principles of dual-energy CT and multi-energy photon-counting CT[J]. Diagn Interv Imaging, 2023, 104(4):167-177. |
| [7] |
Kakitsubata Y, Theodorou DJ, Theodorou SJ, et al. Metastatic disease involving the discovertebral junction of the spine[J]. Joint Bone Spine, 2009, 76(1):50-56.
doi: 10.1016/j.jbspin.2008.03.007 pmid: 18977681 |
| [8] | 郑庆中, 苏洁敏, 李小玲, 等. 18F-FDG PET/CT显像对多发性骨髓瘤与骨转移瘤的鉴别诊断价值[J]. 中国实验血液学杂志, 2020, 28(4):1267-1271. |
| [9] | 张曙光, 于胜吉. 不明原因骨转移瘤的诊疗进展[J]. 癌症进展, 2019, 17(23):2765-2770. |
| [10] | Azar A, Garner HW, Rhodes NG, et al. CT attenuation values do not reliably distinguish benign sclerotic lesions from osteoblastic metastases in patients undergoing bone biopsy[J]. AJR Am J Roentgenol, 2021, 216(4):1022-1030. |
| [11] |
Albano D, Di Luca F, D'Angelo T, et al. Dual-energy CT in musculoskeletal imaging: Technical considerations and clinical applications[J]. Radiol Med, 2024, 129(7):1038-1047.
doi: 10.1007/s11547-024-01827-6 pmid: 38743319 |
| [12] |
Goo HW, Goo JM. Dual-energy CT: New horizon in medical imaging[J]. Korean J Radiol, 2017, 18(4):555-569.
doi: 10.3348/kjr.2017.18.4.555 pmid: 28670151 |
| [13] | Ulano A, Bredella MA, Burke P, et al. Distinguishing untreated osteoblastic metastases from enostoses using CT attenuation measurements[J]. AJR Am J Roentgenol, 2016, 207(2):362-368. |
| [14] | Elangovan SM, Sebro R. Accuracy of CT attenuation measurement for differentiating treated osteoblastic metastases from enostoses[J]. AJR Am J Roentgenol, 2018, 210(3):615-620. |
| [15] |
Stattaus J, Hahn S, Gauler T, et al. Osteoblastic response as a healing reaction to chemotherapy mimicking progressive disease in patients with small cell lung cancer[J]. Eur Radiol, 2009, 19(1):193-200.
doi: 10.1007/s00330-008-1115-6 pmid: 18677488 |
| [16] |
Quattrocchi CC, Santini D, Dell'aia P, et al. A prospective analysis of CT density measurements of bone metastases after treatment with zoledronic acid[J]. Skeletal Radiol, 2007, 36(12):1121-1127.
doi: 10.1007/s00256-007-0388-1 pmid: 17912514 |
| [17] |
Janisch M, Adelsmayr G, Müller H, et al. Non-contrast-enhanced CT texture analysis of primary and metastatic pancreatic ductal adenocarcinomas: Value in assessment of histopathological grade and differences between primary and metastatic lesions[J]. Abdom Radiol (NY), 2022, 47(12):4151-4159.
doi: 10.1007/s00261-022-03646-7 pmid: 36104481 |
| [18] | 岳茜, 李俊, 张莉, 等. CT纹理分析在消化系统恶性肿瘤中的应用进展[J]. 中国医学影像技术, 2019, 35(3):451-454. |
| [19] | 温馨, 左立平, 王勇, 等. CT影像组学鉴别脊柱骨岛与成骨型转移癌[J]. 中国医学影像技术, 2024, 40(5):758-763. |
| [20] | 陶健, 马海彦, 梁甜甜, 等. 能谱CT平扫图像直方图纹理分析对肾盂旁囊肿与肾盂积水的鉴别价值[J]. 中国中西医结合影像学杂志, 2024, 22(2):202-206. |
| [21] |
Faby S, Kuchenbecker S, Sawall S, et al. Performance of today's dual energy CT and future multi energy CT in virtual non-contrast imaging and in iodine quantification: A simulation study[J]. Med Phys, 2015, 42(7):4349-4366.
doi: 10.1118/1.4922654 pmid: 26133632 |
| [22] | Bedard T, Mohammed M, Serinelli S, et al. Atypical enostoses-series of ten cases and literature review[J]. Medicina (Kaunas), 2020, 56(10):534. |
| [23] |
Nagayama Y, Tanoue S, Inoue T, et al. Dual-layer spectral CT improves image quality of multiphasic pancreas CT in patients with pancreatic ductal adenocarcinoma[J]. Eur Radiol, 2020, 30(1):394-403.
doi: 10.1007/s00330-019-06337-y pmid: 31312889 |
| [24] | 吴辉, 犹露, 彭娟, 等. 多时相CT影像组学模型预测胸腺瘤风险分类[J]. 中国医学影像技术, 2023, 39(9):1341-1345. |
| [25] |
Reinert CP, Krieg E, Esser M, et al. Role of computed tomography texture analysis using dual-energy-based bone marrow imaging for multiple myeloma characterization: Comparison with histology and established serologic parameters[J]. Eur Radiol, 2021, 31(4):2357-2367.
doi: 10.1007/s00330-020-07320-8 pmid: 33011876 |
| [26] | Sala F, Dapoto A, Morzenti C, et al. Bone islands incidentally detected on computed tomography: Frequency of enostosis and differentiation from untreated osteoblastic metastases based on CT attenuation value[J]. Br J Radiol, 2019, 92(1103):20190249. |
| [27] |
Macedo F, Ladeira K, Pinho F, et al. Bone metastases: An overview[J]. Oncol Rev, 2017, 11(1):321.
doi: 10.4081/oncol.2017.321 pmid: 28584570 |
| [28] | Grunewald M, Kumar S, Sharife H, et al. Counteracting age-related VEGF signaling insufficiency promotes healthy aging and extends life span[J]. Science, 2021, 373(6554):eabc8479. |
| [29] | Zhao Y, Wang X, Che T, et al. Multi-task deep learning for medical image computing and analysis: A review[J]. Comput Biol Med, 2023, 153:106496. |
| [1] | Wang Zhuangzhuang, Ren Huan, Liu Yanting, Tian Chunlei, Ai Wenbing. Construction of a nomogram to predict the risk of lung metastasis in extremity osteosarcomas based on the SEER database and its validation [J]. Clinical Focus, 2024, 39(5): 413-419. |
| [2] | . [J]. CLINICAL FOCUS, 2013, 28(3): 332-0. |
| [3] | . [J]. Clinical Focus, 2012, 27(17): 1535-1537. |
| [4] | . [J]. Clinical Focus, 2012, 27(16): 1470-0. |
| [5] | . [J]. Clinical Focus, 2012, 27(9): 810-811. |
| [6] | . [J]. Clinical Focus, 2012, 27(7): 618-619. |
| [7] | . [J]. CLINICAL FOCUS, 2011, 26(1): 66-67. |
| [8] | . [J]. CLINICAL FOCUS, 2010, 25(18): 1642-0. |
| [9] | . [J]. CLINICAL FOCUS, 2010, 25(10): 900-900. |
| [10] | . [J]. CLINICAL FOCUS, 2008, 23(12): 899-900. |
| [11] | . [J]. CLINICAL FOCUS, 2005, 20(17): 1002-1003. |
| Viewed | ||||||
|
Full text |
|
|||||
|
Abstract |
|
|||||