Clinical Focus ›› 2026, Vol. 41 ›› Issue (9): 831-836.doi: 10.3969/j.issn.1004-583X.2026.09.008
Previous Articles Next Articles
Correlation of serum FCER1G, NRF2, and CXCL13 expression with diabetic peripheral neuropathy in patients with type 2 diabetes mellitus and their auxiliary identification value
Xu Shanshan( ), Cui Huijuan, Chen Hua, Song Na, Liu Sijia, Wang Saifei, Li Xin
Department of Endocrinology ,the Third People's Hospital of Zhengzhou Zhengzhou 450000, China
-
Received:2026-06-01Online:2026-09-20Published:2026-09-17 -
Contact:Xu Shanshan E-mail:xushanshan202619@163.com

CLC Number:
Cite this article
Xu Shanshan, Cui Huijuan, Chen Hua, Song Na, Liu Sijia, Wang Saifei, Li Xin. Correlation of serum FCER1G, NRF2, and CXCL13 expression with diabetic peripheral neuropathy in patients with type 2 diabetes mellitus and their auxiliary identification value[J]. Clinical Focus, 2026, 41(9): 831-836.
share this article
Add to citation manager EndNote|Ris|BibTeX
URL: https://www.lchc.cn/EN/10.3969/j.issn.1004-583X.2026.09.008
| 项目 | N-DPN组(n=95) | DPN组(n=76) | χ2/t值 | P值 |
|---|---|---|---|---|
| 年龄(岁) | 58.46±8.15 | 60.24±9.73 | 1.302 | 0.195 |
| 性别[例(%)] | ||||
| 男 女 | 52(54.74) 43(45.26) | 37(48.68) 39(51.32) | 0.620 | 0.431 |
| BMI(kg/m2) | 24.64±2.54 | 25.16±2.59 | 1.319 | 0.189 |
| 高血压史[例(%)] | ||||
| 有 无 | 41(43.16) 54(56.84) | 40(52.63) 36(47.37) | 1.520 | 0.218 |
| 糖尿病病程(年) | 4.26±1.17 | 5.13±1.68 | 3.984 | <0.001 |
| 空腹血糖(mmol/L) | 8.62±1.07 | 8.85±1.21 | 1.318 | 0.189 |
| HbA1c(%) | 7.94±1.55 | 8.73±1.63 | 3.237 | 0.001 |
| 总胆固醇(mmol/L) | 4.59±0.97 | 4.88±1.16 | 1.780 | 0.077 |
| 甘油三酯(mmol/L) | 1.57±0.29 | 1.66±0.41 | 1.679 | 0.095 |
| 高密度脂蛋白胆固醇(mmol/L) | 1.12±0.21 | 1.07±0.18 | 1.647 | 0.101 |
| 低密度脂蛋白胆固醇(mmol/L) | 2.35±0.23 | 2.41±0.28 | 1.539 | 0.126 |
| 收缩压(mmHg) | 122.45±13.17 | 125.36±13.58 | 1.416 | 0.159 |
| 舒张压(mmHg) | 80.37±8.27 | 82.51±9.06 | 1.611 | 0.109 |
| 降糖治疗[例(%)] | ||||
| 胰岛素分泌促进剂 | 9(9.47) | 12(15.79) | ||
| 胰岛素增敏剂 | 19(20.00) | 9(11.84) | ||
| α-葡萄糖苷酶抑制剂 | 18(18.95) | 15(19.74) | 3.752 | 0.441 |
| SGLT2抑制剂 | 12(12.63) | 7(9.21) | ||
| 注射胰岛素 | 37(38.95) | 33(43.42) | ||
| 白细胞计数(×109/L) | 4.86±0.64 | 5.05±0.82 | 1.702 | 0.091 |
| IL-6(ng/L) | 12.64±3.64 | 19.25±5.03 | 9.960 | <0.001 |
Tab.1 Comparison of clinical characteristics between the two groups
| 项目 | N-DPN组(n=95) | DPN组(n=76) | χ2/t值 | P值 |
|---|---|---|---|---|
| 年龄(岁) | 58.46±8.15 | 60.24±9.73 | 1.302 | 0.195 |
| 性别[例(%)] | ||||
| 男 女 | 52(54.74) 43(45.26) | 37(48.68) 39(51.32) | 0.620 | 0.431 |
| BMI(kg/m2) | 24.64±2.54 | 25.16±2.59 | 1.319 | 0.189 |
| 高血压史[例(%)] | ||||
| 有 无 | 41(43.16) 54(56.84) | 40(52.63) 36(47.37) | 1.520 | 0.218 |
| 糖尿病病程(年) | 4.26±1.17 | 5.13±1.68 | 3.984 | <0.001 |
| 空腹血糖(mmol/L) | 8.62±1.07 | 8.85±1.21 | 1.318 | 0.189 |
| HbA1c(%) | 7.94±1.55 | 8.73±1.63 | 3.237 | 0.001 |
| 总胆固醇(mmol/L) | 4.59±0.97 | 4.88±1.16 | 1.780 | 0.077 |
| 甘油三酯(mmol/L) | 1.57±0.29 | 1.66±0.41 | 1.679 | 0.095 |
| 高密度脂蛋白胆固醇(mmol/L) | 1.12±0.21 | 1.07±0.18 | 1.647 | 0.101 |
| 低密度脂蛋白胆固醇(mmol/L) | 2.35±0.23 | 2.41±0.28 | 1.539 | 0.126 |
| 收缩压(mmHg) | 122.45±13.17 | 125.36±13.58 | 1.416 | 0.159 |
| 舒张压(mmHg) | 80.37±8.27 | 82.51±9.06 | 1.611 | 0.109 |
| 降糖治疗[例(%)] | ||||
| 胰岛素分泌促进剂 | 9(9.47) | 12(15.79) | ||
| 胰岛素增敏剂 | 19(20.00) | 9(11.84) | ||
| α-葡萄糖苷酶抑制剂 | 18(18.95) | 15(19.74) | 3.752 | 0.441 |
| SGLT2抑制剂 | 12(12.63) | 7(9.21) | ||
| 注射胰岛素 | 37(38.95) | 33(43.42) | ||
| 白细胞计数(×109/L) | 4.86±0.64 | 5.05±0.82 | 1.702 | 0.091 |
| IL-6(ng/L) | 12.64±3.64 | 19.25±5.03 | 9.960 | <0.001 |
| 组别 | 例数 | FCER1G (ng/L) | NRF2 (ng/L) | CXCL13 (μg/L) |
|---|---|---|---|---|
| N-DPN组 | 95 | 474.37±54.87 | 218.36±47.69 | 8.83±2.65 |
| DPN组 | 76 | 526.58±61.64 | 179.51±33.75 | 12.54±3.26 |
| t值 | 5.852 | 5.744 | 8.210 | |
| P值 | <0.001 | <0.001 | <0.001 |
Tab.2 Comparison of serum FCER1G, NRF2 and CXCL13 levels between the two groups
| 组别 | 例数 | FCER1G (ng/L) | NRF2 (ng/L) | CXCL13 (μg/L) |
|---|---|---|---|---|
| N-DPN组 | 95 | 474.37±54.87 | 218.36±47.69 | 8.83±2.65 |
| DPN组 | 76 | 526.58±61.64 | 179.51±33.75 | 12.54±3.26 |
| t值 | 5.852 | 5.744 | 8.210 | |
| P值 | <0.001 | <0.001 | <0.001 |
| 指标 | FCER1G | NRF2 | CXCL13 | |||||
|---|---|---|---|---|---|---|---|---|
| r值 | P值 | r值 | P值 | r值 | P值 | |||
| 糖尿病病程 | 0.433 | <0.001 | -0.417 | <0.001 | 0.429 | <0.001 | ||
| HbA1c | 0.502 | <0.001 | -0.449 | <0.001 | 0.453 | <0.001 | ||
| IL-6 | 0.448 | <0.001 | -0.485 | <0.001 | 0.495 | <0.001 | ||
Tab.3 Correlation of serum FCER1G, NRF2, CXCL13 levels with clinical characteristics
| 指标 | FCER1G | NRF2 | CXCL13 | |||||
|---|---|---|---|---|---|---|---|---|
| r值 | P值 | r值 | P值 | r值 | P值 | |||
| 糖尿病病程 | 0.433 | <0.001 | -0.417 | <0.001 | 0.429 | <0.001 | ||
| HbA1c | 0.502 | <0.001 | -0.449 | <0.001 | 0.453 | <0.001 | ||
| IL-6 | 0.448 | <0.001 | -0.485 | <0.001 | 0.495 | <0.001 | ||
| 指标 | β | SE | Waldχ2值 | P值 | OR值 | 95%CI |
|---|---|---|---|---|---|---|
| 糖尿病病程 | 0.515 | 0.169 | 9.294 | 0.002 | 1.674 | 1.202~2.331 |
| HbA1c | 0.546 | 0.208 | 6.900 | 0.009 | 1.727 | 1.149~2.596 |
| IL-6 | 0.583 | 0.195 | 8.949 | 0.003 | 1.792 | 1.223~2.626 |
| FCER1G | 0.965 | 0.297 | 10.550 | 0.001 | 2.624 | 1.466~4.697 |
| NRF2 | -0.377 | 0.119 | 10.030 | 0.002 | 0.686 | 0.543~0.866 |
| CXCL13 | 1.000 | 0.325 | 9.465 | 0.002 | 2.718 | 1.437~5.139 |
Tab.4 Multivariate logistic regression analysis of related factors of DPN in patients with T2DM
| 指标 | β | SE | Waldχ2值 | P值 | OR值 | 95%CI |
|---|---|---|---|---|---|---|
| 糖尿病病程 | 0.515 | 0.169 | 9.294 | 0.002 | 1.674 | 1.202~2.331 |
| HbA1c | 0.546 | 0.208 | 6.900 | 0.009 | 1.727 | 1.149~2.596 |
| IL-6 | 0.583 | 0.195 | 8.949 | 0.003 | 1.792 | 1.223~2.626 |
| FCER1G | 0.965 | 0.297 | 10.550 | 0.001 | 2.624 | 1.466~4.697 |
| NRF2 | -0.377 | 0.119 | 10.030 | 0.002 | 0.686 | 0.543~0.866 |
| CXCL13 | 1.000 | 0.325 | 9.465 | 0.002 | 2.718 | 1.437~5.139 |
| 变量 | 曲线下面积 | SE | P值 | 95%CI | 敏感度(%) | 特异度(%) | 界值 |
|---|---|---|---|---|---|---|---|
| FCER1G | 0.770 | 0.036 | <0.001 | 0.698~0.841 | 72.37 | 78.95 | 507.55 ng/L |
| NRF2 | 0.786 | 0.034 | <0.001 | 0.719~0.854 | 71.05 | 76.84 | 199.20 ng/L |
| CXCL13 | 0.775 | 0.036 | <0.001 | 0.704~0.846 | 68.42 | 81.05 | 11.50 μg/L |
| 三者联合 | 0.900 | 0.022 | <0.001 | 0.857~0.944 | 86.84 | 75.79 | - |
Tab.5 The auxiliary identification value of serum FCER1G, NRF2 and CXCL13 levels for DPN in patients with T2DM
| 变量 | 曲线下面积 | SE | P值 | 95%CI | 敏感度(%) | 特异度(%) | 界值 |
|---|---|---|---|---|---|---|---|
| FCER1G | 0.770 | 0.036 | <0.001 | 0.698~0.841 | 72.37 | 78.95 | 507.55 ng/L |
| NRF2 | 0.786 | 0.034 | <0.001 | 0.719~0.854 | 71.05 | 76.84 | 199.20 ng/L |
| CXCL13 | 0.775 | 0.036 | <0.001 | 0.704~0.846 | 68.42 | 81.05 | 11.50 μg/L |
| 三者联合 | 0.900 | 0.022 | <0.001 | 0.857~0.944 | 86.84 | 75.79 | - |
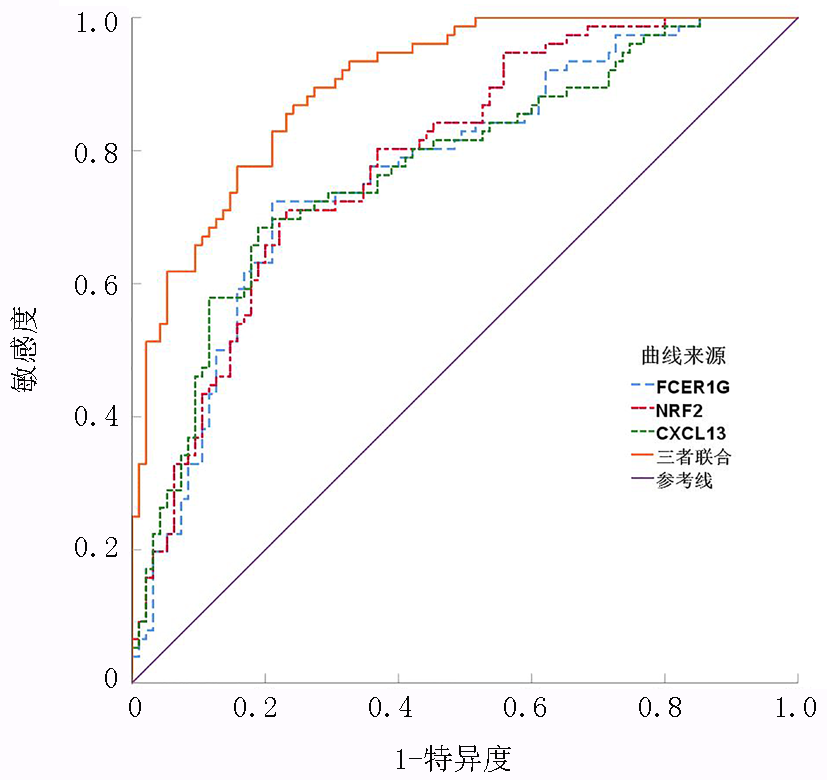
Fig.1 ROC curves of the serum FCER1G, NRF2, and CXCL13 levels for the auxiliary identification of DPN in patients with T2DM
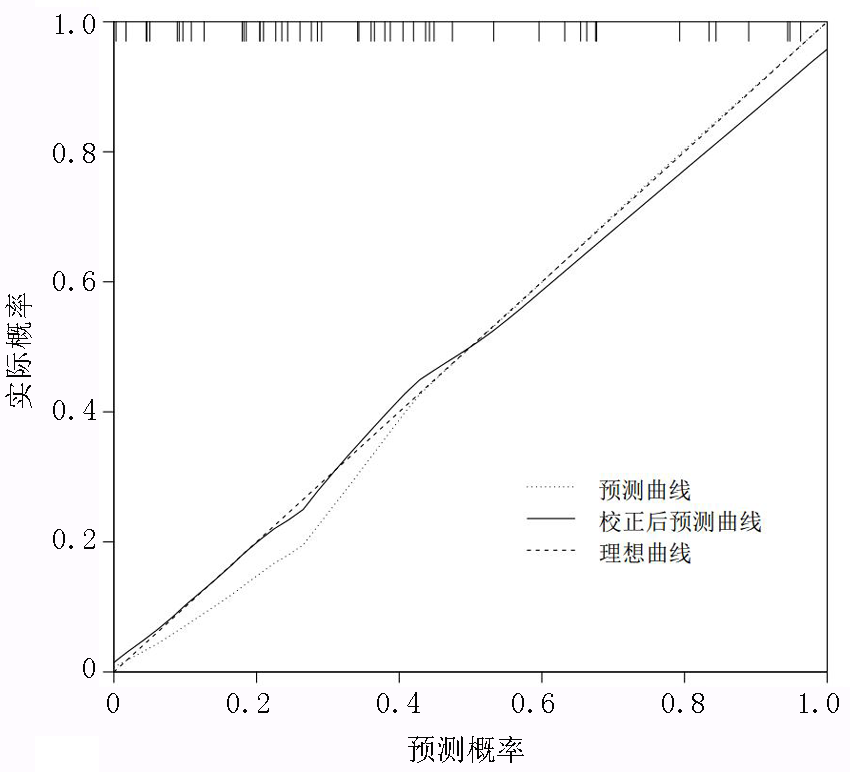
Fig.2 Internal validation curve of the combined model
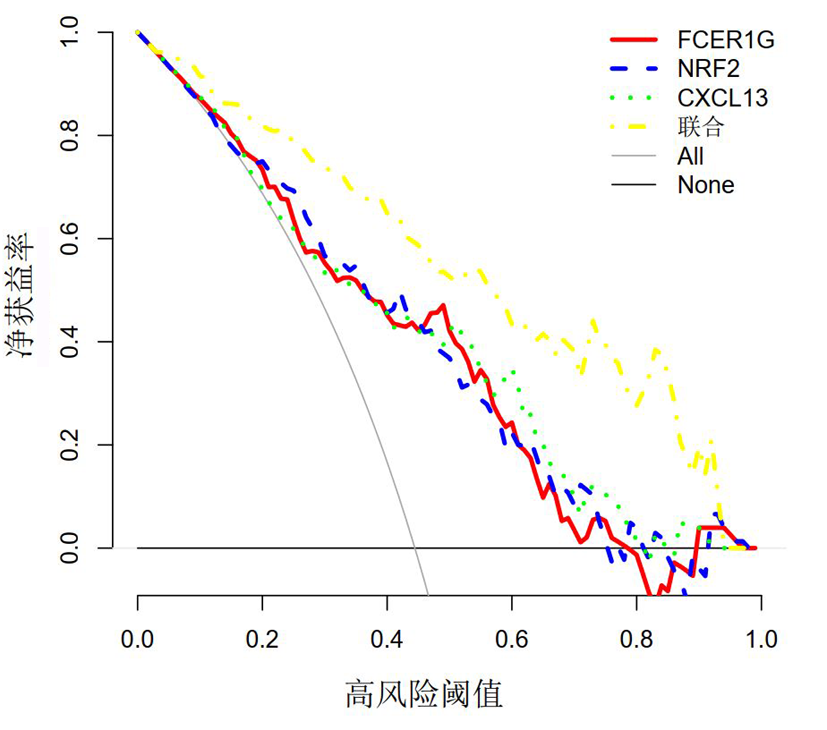
Fig.3 DCA curves of FCER1G, NRF2 and CXCL13 alone and in combination
| [1] | 叶飞, 笪义生, 王剑. 血清C-C基序趋化因子配体11与磷酸化神经丝蛋白重链联合预测2型糖尿病周围神经病变的临床价值[J]. 实用临床医药杂志, 2025, 29(16):89-95. doi: 10.7619/jcmp.20251811. |
| [2] | 程凯倩, 朱钊, 刘培欣, 等. 2型糖尿病并发痛性糖尿病周围神经病变风险的列线图预测模型构建与验证[J]. 临床内科杂志, 2025, 42(9):738-741. doi: 10.3969/j.issn.1001-9057.2025.09.008. |
| [3] | Ullah S, Iqbal K, Rizwan M. Gait and postural control deficits in diabetic patients with peripheral neuropathy compared to healthy controls[J]. Bioengineering (Basel), 2025, 12(10):1034. doi: 10.3390/bioengineering12101034. |
| [4] | Chen X, Liu Q, Chen N, et al. Diagnostic biomarker for type 2 diabetic peripheral neuropathy via comprehensive bioinformatics analysis[J]. J Diabetes, 2024, 16(3):e13506. doi: 10.1111/1753-0407.13506. |
| [5] | Liang W, Song Y, Yang Z, et al. Disruption of circadian NRF2 expression and its impact on pain sensitivity in diabetes peripheral neuropathy[J]. Pain Res Manag, 2025, 2025:5510019. doi: 10.1155/prm/5510019. |
| [6] |
Zheng K, Chen M, Xu X, et al. Chemokine CXCL13-CXCR5 signaling in neuroinflammation and pathogenesis of chronic pain and neurological diseases[J]. Cell Mol Biol Lett, 2024, 29(1):134. doi: 10.1186/s11658-024-00653-y.
pmid: 39472796 |
| [7] | 中华医学会糖尿病学分会. 中国2型糖尿病防治指南(2020年版)[J]. 中华糖尿病杂志, 2021, 13(4):315-409. doi: 10.3760/cma.j.cn115791-20210221-00095. |
| [8] | 中华医学会糖尿病学分会神经并发症学组. 糖尿病神经病变诊治专家共识(2021年版)[J]. 中华糖尿病杂志, 2021, 13(6):540-557. doi: 10.3760/cma.j.cn115791-20210310-00143. |
| [9] | Zglejc-Waszak K, Kordas B, Korytko A, et al. RAGE cytosolic partner diaph1 does not play an essential role in diabetic peripheral neuropathy progression[J]. Cells, 2025, 14(20):1635. doi: 10.3390/cells14201635. |
| [10] | 郝艳, 徐燕. 血清铁蛋白、miR-122表达水平预测2型糖尿病患者并发糖尿病周围神经病变的价值[J]. 广西医学, 2025, 47(6):814-818. doi: 10.11675/j.issn.0253-4304.2025.06.06. |
| [11] |
Feldner AC, Turner AK, Simpson JF, et al. Skipping of FCER1G exon 2 is common in human brain but not associated with the Alzheimer's disease genetic risk factor rs2070902[J]. J Alzheimers Dis Rep, 2023, 7(1):1313-1322. doi: 10.3233/ADR-230076.
pmid: 38143775 |
| [12] |
Hu X, Xu Lou I, et al. Integrated bioinformatic analysis of the shared molecular mechanisms between ANCA-associated vasculitis and atherosclerosis[J]. Arthritis Res Ther, 2024, 26(1):223. doi: 10.1186/s13075-024-03448-w.
pmid: 39702436 |
| [13] | Stoll AC, Kemp CJ, Patterson JR, et al. Neuroinflammatory gene expression profiles of reactive glia in the substantia nigra suggest a multidimensional immune response to alpha synuclein inclusions[J]. Neurobiol Dis, 2024, 191:106411. doi: 10.1016/j.nbd.2024.106411. |
| [14] | O'Rourke SA, Shanley LC, Dunne A. The Nrf2-HO-1 system and inflammaging[J]. Front Immunol, 2024, 15:1457010. doi: 10.3389/fimmu.2024.1457010. |
| [15] | Chen J, Lu Y, Chen Y, et al. Circ_0000756 mediates oxidative stress and metabolic memory in diabetic neuropathy via miR-7b suppression of NRF2/ARE pathway[J]. FASEB J, 2025, 39(21):e71148. doi: 10.1096/fj.202501968R. |
| [16] | Zhang JG, Cai JP, Wu YX, et al. Pandanus tectorius fruits attenuated cell injury and oxidative stress in high glucose-induced Schwann cells by activating Nrf2/Keap1 signaling pathway[J]. J Asian Nat Prod Res, 2025, 27(8):1188-1204. doi: 10.1080/10286020.2025.2451340. |
| [17] | Sun S, Sun Y, Shen J, et al. CXCL13/CXCR5: A new target for pain treatment[J]. Int J Surg, 2025, 111(9):6318-6329. doi: 10.1097/JS9.0000000000002764. |
| [18] | Trolese MC, Mariani A, Terao M, et al. CXCL13/CXCR5 signalling is pivotal to preserve motor neurons in amyotrophic lateral sclerosis[J]. EBioMedicine, 2020, 62:103097. doi: 10.1016/j.ebiom.2020.103097. |
| [19] | Wang J, Yin C, Pan Y, et al. CXCL13 contributes to chronic pain of a mouse model of CRPS-I via CXCR5-mediated NF-κB activation and pro-inflammatory cytokine production in spinal cord dorsal horn[J]. J Neuroinflammation, 2023, 20(1):109. doi: 10.1186/s12974-023-02778-x. |
| [1] | Tian Xiaofei, Rao Xiaojuan, Shi Shuangwei, Fang Yifan. Association of serum spexin and TSH levels with peripheral neuropathy in euthyroid patients with type 2 diabetes mellitus [J]. Clinical Focus, 2026, 41(6): 529-533. |
| [2] | Ju Yan, Guo Peng, Wu Botao, Liu Xinyu. Correlation between ratio of salivary uric acid to blood uric acid and diabetic peripheral neuropathy [J]. Clinical Focus, 2023, 38(1): 37-41. |
| [3] | Zhu Juhua, Huang Jie, Jiang Weiqing, Dong Jun. Clinical features of patients with diabetic cranial neuropathy and effect on prognosis [J]. Clinical Focus, 2018, 33(9): 792-795. |
| [4] | Chen Binjuan, Mu Jingjing, Wang Yuan, Wang Yindi, Tong Minghui. Ultrasonic study of upper linb nerve in type 2 diabetes mellitus with diabetic peripheral neuropathy [J]. Clinical Focus, 2018, 33(8): 691-694. |
| [5] | He Ke,Zhu Lihua,Lu Xiwan,Hu Yuan, Zhou Weiqiang, Jiang Yan, Liu Ling, Bian Rongrong. Analysis of related factors of diabetic peripheral neuropathy in patients with type 2 diabetes mellitus [J]. Clinical Focus, 2018, 33(2): 115-117,121. |
| [6] | Zhang Leia, Li Zhanhuib, Yang Lic, Li Jinga. Clinical and neurophysiological features in patients with impaired glucose regulation [J]. Clinical Focus, 2018, 33(12): 1057-1060. |
| [7] | ZHANG Yun-qian;YANG Xiao-ping;LUO Li-hua;LIU Yao;WANG Jian-lin. Value of skin sympathetic response in early diagnosis of diabetic peripheral neuropathy [J]. Clinical Focus, 2014, 29(6): 658-661. |
| Viewed | ||||||
|
Full text |
|
|||||
|
Abstract |
|
|||||