Clinical Focus ›› 2026, Vol. 41 ›› Issue (10): 891-900.doi: 10.3969/j.issn.1004-583X.2026.10.004
Previous Articles Next Articles
Association of inflammatory cell ratios with depressive symptoms and short-term treatment response
Wang Xiaohana, Wang Dongzeb, Han Binga( )
- a
Department of Autonomic Neuropathies the First Hospital of Hebei Medical University Shijiazhuang 050031, China
bDepartment of Psychosomatic Medicine ,the First Hospital of Hebei Medical University Shijiazhuang 050031, China
-
Received:2026-09-30Online:2026-10-20Published:2026-10-10 -
Contact:Han Bing E-mail:Hanbing1987@hebmu.edu.cn

CLC Number:
Cite this article
Wang Xiaohan, Wang Dongze, Han Bing. Association of inflammatory cell ratios with depressive symptoms and short-term treatment response[J]. Clinical Focus, 2026, 41(10): 891-900.
share this article
Add to citation manager EndNote|Ris|BibTeX
URL: https://www.lchc.cn/EN/10.3969/j.issn.1004-583X.2026.10.004
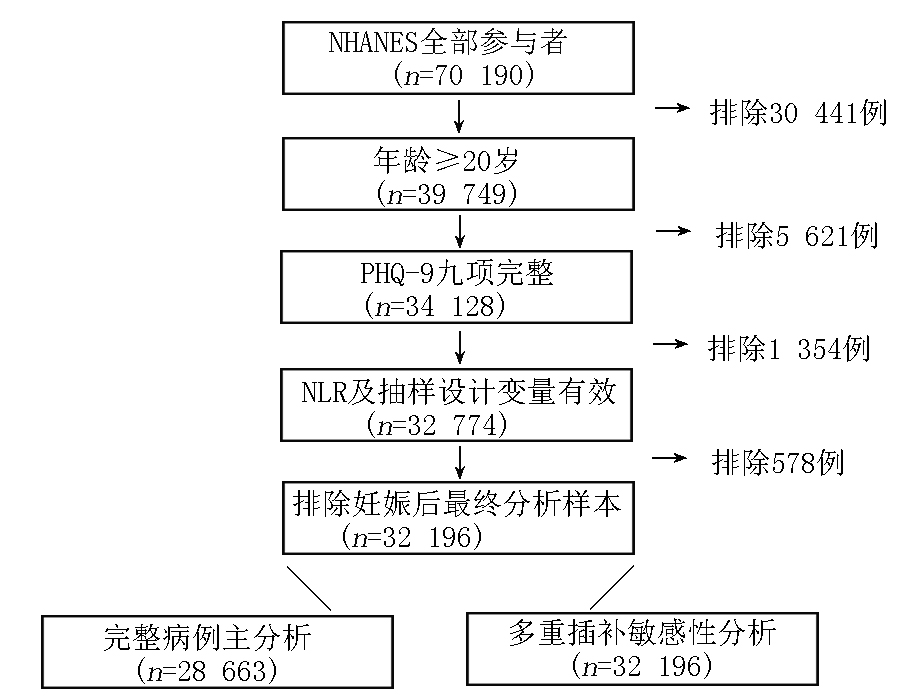
Fig. 1 NHANES 2005-2018 participant selection flowchart
| 特征 | 总体 | PHQ-9总分<10分 | PHQ-9总分≥10分 |
|---|---|---|---|
| 年龄(岁) | 47.5(0.2) | 47.6(0.3) | 46.7(0.4) |
| 女性[例(%)] | 14 303(50.6) | 12 736(49.5) | 1 567(64.2) |
| 高中以上教育[例(%)] | 15 424(62.0) | 14 394(63.0) | 1 030(48.8) |
| 已婚或有伴侣[例(%)] | 17 237(64.2) | 16 114(65.4) | 1 123(48.6) |
| 家庭收入与贫困线比值 | 3.08(1.53~5.00) | 3.21(1.64~5.00) | 1.65(0.90~3.21) |
| BMI(kg/m2) | 29.1(0.1) | 29.0(0.1) | 30.7(0.2) |
| 当前吸烟[例(%)] | 5 951(20.2) | 5 030(18.7) | 921(39.3) |
| 糖尿病[例(%)] | 3 678(9.5) | 3 197(9.0) | 481(14.9) |
| 高血压[例(%)] | 12 312(37.9) | 11 043(37.2) | 1 269(47.3) |
| NLR | 1.96(1.50~2.59) | 1.95(1.50~2.58) | 2.06(1.50~2.76) |
| SII | 474.2(343.6~662.4) | 471.7(342.5~656.0) | 505.7(359.7~736.0) |
Tab.1 Selected weighted characteristics of the fully adjusted NHANES sample
| 特征 | 总体 | PHQ-9总分<10分 | PHQ-9总分≥10分 |
|---|---|---|---|
| 年龄(岁) | 47.5(0.2) | 47.6(0.3) | 46.7(0.4) |
| 女性[例(%)] | 14 303(50.6) | 12 736(49.5) | 1 567(64.2) |
| 高中以上教育[例(%)] | 15 424(62.0) | 14 394(63.0) | 1 030(48.8) |
| 已婚或有伴侣[例(%)] | 17 237(64.2) | 16 114(65.4) | 1 123(48.6) |
| 家庭收入与贫困线比值 | 3.08(1.53~5.00) | 3.21(1.64~5.00) | 1.65(0.90~3.21) |
| BMI(kg/m2) | 29.1(0.1) | 29.0(0.1) | 30.7(0.2) |
| 当前吸烟[例(%)] | 5 951(20.2) | 5 030(18.7) | 921(39.3) |
| 糖尿病[例(%)] | 3 678(9.5) | 3 197(9.0) | 481(14.9) |
| 高血压[例(%)] | 12 312(37.9) | 11 043(37.2) | 1 269(47.3) |
| NLR | 1.96(1.50~2.59) | 1.95(1.50~2.58) | 2.06(1.50~2.76) |
| SII | 474.2(343.6~662.4) | 471.7(342.5~656.0) | 505.7(359.7~736.0) |
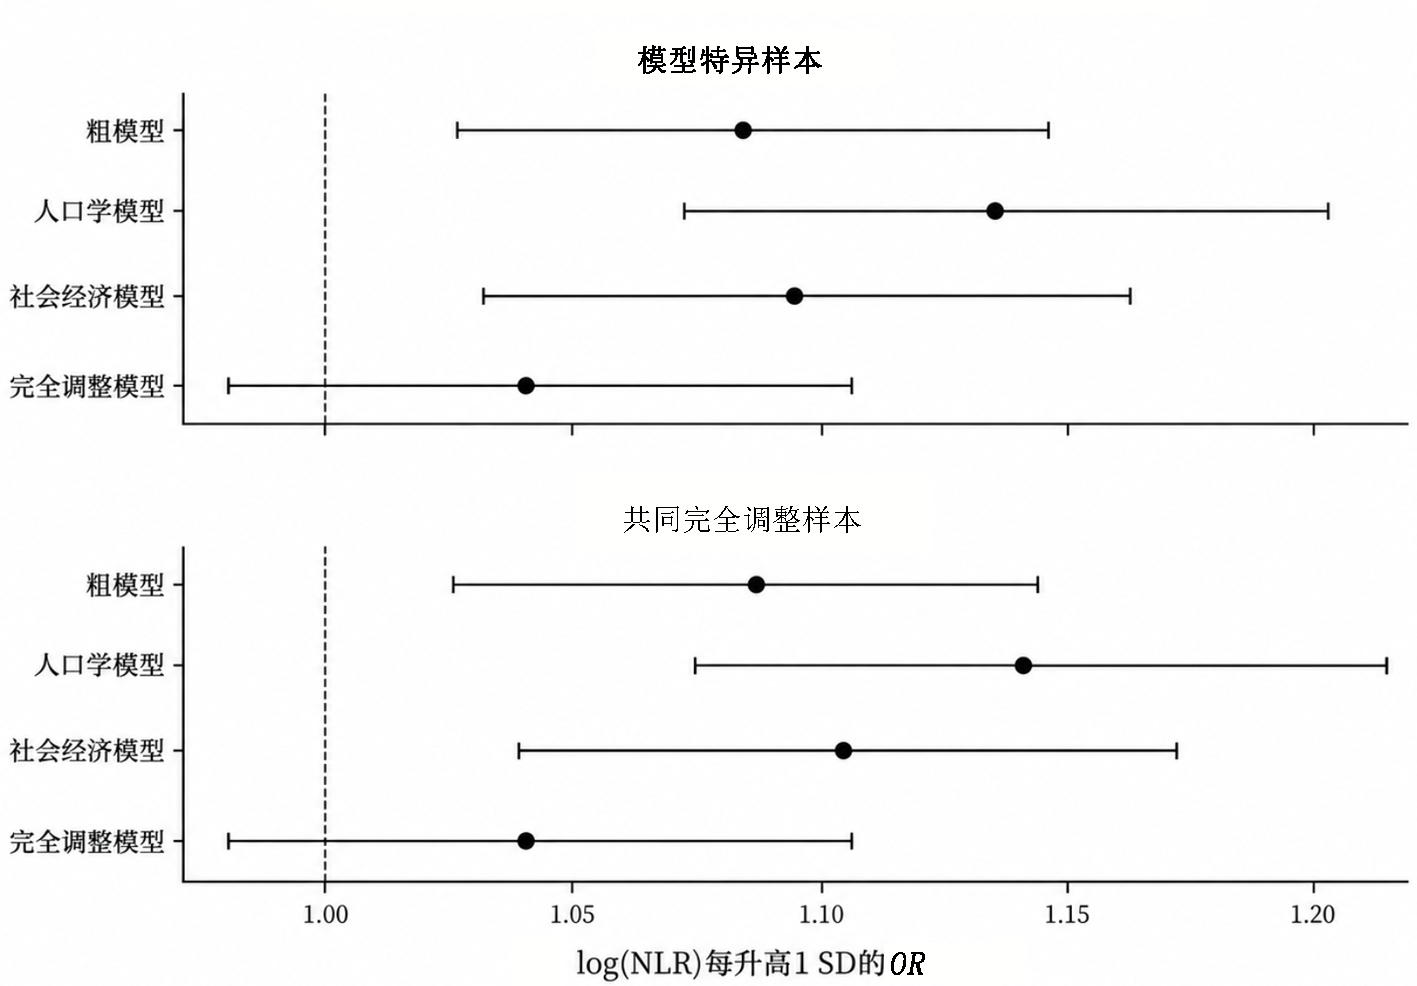
Fig. 2 Stepwise adjustment results for the association between standardized log(NLR) and PHQ-9≥10
| 分析 | 效应值 | 95%CI | P值 | 例数 |
|---|---|---|---|---|
| 完全调整线性模型,OR/1 SD | 1.041 | 0.980~1.106 | 0.192 | 28 663 |
| 多重插补,OR/1 SD | 1.036 | 0.979~1.096 | 0.221 | 32 196 |
| P1~P99样条:总体关联 | - | - | 0.002 | 28 104 |
| P1~P99样条:非线性 | - | - | 0.007 | 28 104 |
| 炎症排除样条:非线性 | - | - | 0.045 | 24 517 |
| 替代结点样条:非线性 | - | - | 0.012 | 28 104 |
| 增加饮酒状态,OR/1 SD | 1.040 | 0.978~1.106 | 0.208 | 28 612 |
| 2007-2018年增加体力活动,OR/1 SD | 1.036 | 0.969~1.107 | 0.294 | 24 949 |
| 排除急性/炎症相关情况,OR/1 SD | 1.053 | 0.968~1.145 | 0.229 | 24 517 |
Tab.2 Main linear, nonlinear, and sensitivity analyses of NHANES data
| 分析 | 效应值 | 95%CI | P值 | 例数 |
|---|---|---|---|---|
| 完全调整线性模型,OR/1 SD | 1.041 | 0.980~1.106 | 0.192 | 28 663 |
| 多重插补,OR/1 SD | 1.036 | 0.979~1.096 | 0.221 | 32 196 |
| P1~P99样条:总体关联 | - | - | 0.002 | 28 104 |
| P1~P99样条:非线性 | - | - | 0.007 | 28 104 |
| 炎症排除样条:非线性 | - | - | 0.045 | 24 517 |
| 替代结点样条:非线性 | - | - | 0.012 | 28 104 |
| 增加饮酒状态,OR/1 SD | 1.040 | 0.978~1.106 | 0.208 | 28 612 |
| 2007-2018年增加体力活动,OR/1 SD | 1.036 | 0.969~1.107 | 0.294 | 24 949 |
| 排除急性/炎症相关情况,OR/1 SD | 1.053 | 0.968~1.145 | 0.229 | 24 517 |
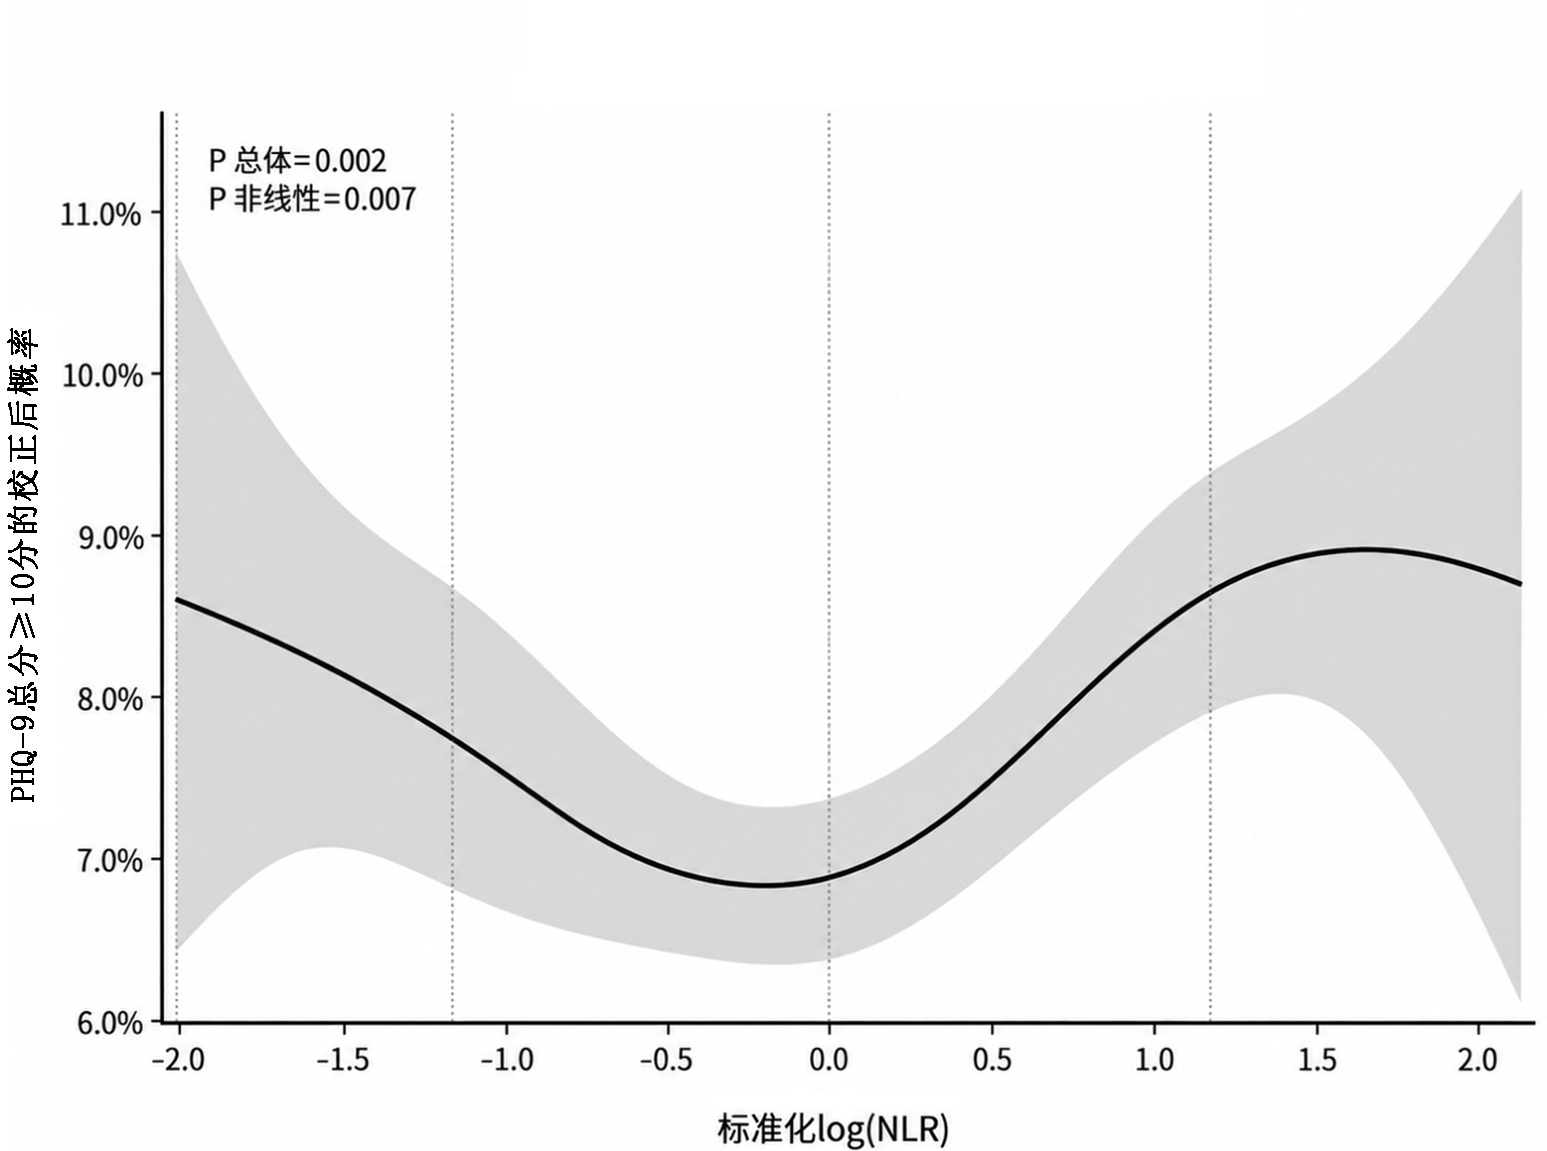
Fig. 3 Nonlinear association between standardized log(NLR) and the adjusted probability of PHQ-9 ≥10 across the P1-P99 range
| 指标 | 观察值 |
|---|---|
| 基线样本 | 320 |
| 2周/4周/8周HAMD-17可用 | 316/310/300 |
| 年龄(岁) | 42.7±12.7 |
| 女性[例(%)] | 221(69.1) |
| 住院[例(%)] | 216(67.5) |
| BMI(kg/m2) | 25.1±3.9 |
| 复发性抑郁[例(%)] | 168(52.5) |
| 治疗抵抗[例(%)] | 85(26.6) |
| 焦虑共病[例(%)] | 123(38.4) |
| 精神病性症状[例(%)] | 23(7.2) |
| NLR | 1.99(1.31~2.94) |
| 基线HAMD-17总分 | 24.38±5.21 |
| 8周HAMD-17总分 | 10.37±4.54 |
| 8周反应/缓解[例(%)] | 222/300(74.0)/89/300(29.7) |
| 炎症排除队列/重复CBC | 273/169 |
Tab.3 Main characteristics and outcomes of the hospital-based cohort
| 指标 | 观察值 |
|---|---|
| 基线样本 | 320 |
| 2周/4周/8周HAMD-17可用 | 316/310/300 |
| 年龄(岁) | 42.7±12.7 |
| 女性[例(%)] | 221(69.1) |
| 住院[例(%)] | 216(67.5) |
| BMI(kg/m2) | 25.1±3.9 |
| 复发性抑郁[例(%)] | 168(52.5) |
| 治疗抵抗[例(%)] | 85(26.6) |
| 焦虑共病[例(%)] | 123(38.4) |
| 精神病性症状[例(%)] | 23(7.2) |
| NLR | 1.99(1.31~2.94) |
| 基线HAMD-17总分 | 24.38±5.21 |
| 8周HAMD-17总分 | 10.37±4.54 |
| 8周反应/缓解[例(%)] | 222/300(74.0)/89/300(29.7) |
| 炎症排除队列/重复CBC | 273/169 |
| 结局 | 效应量 | 估计值 | 95%CI | P值 |
|---|---|---|---|---|
| 基线PHQ-9总分≥10分 | OR | 0.750 | 0.520~1.080 | 0.122 |
| 基线PHQ-9总分 | β | -0.146 | -0.600~0.308 | 0.527 |
| 基线HAMD-17总分 | β | -0.295 | -1.053~0.463 | 0.444 |
| 8周HAMD-17总分(基线调整ANCOVA,HC3稳健标准误) | β | 0.567 | 0.038~1.095 | 0.036 |
| 治疗反应≥50% | OR | 0.748 | 0.511~1.096 | 0.136 |
| 缓解,HAMD-17总分≤7分 | OR | 0.703 | 0.483~1.023 | 0.066 |
| 4周时间×NLR | β | 0.442 | 0.120~0.764 | 0.007 |
| 8周时间×NLR | β | 0.635 | 0.311~0.960 | <0.001 |
| 8周HAMD-17总分样条非线性 | F检验 | - | - | 0.217 |
Tab.4 Main and longitudinal model results for the hospital-based cohort
| 结局 | 效应量 | 估计值 | 95%CI | P值 |
|---|---|---|---|---|
| 基线PHQ-9总分≥10分 | OR | 0.750 | 0.520~1.080 | 0.122 |
| 基线PHQ-9总分 | β | -0.146 | -0.600~0.308 | 0.527 |
| 基线HAMD-17总分 | β | -0.295 | -1.053~0.463 | 0.444 |
| 8周HAMD-17总分(基线调整ANCOVA,HC3稳健标准误) | β | 0.567 | 0.038~1.095 | 0.036 |
| 治疗反应≥50% | OR | 0.748 | 0.511~1.096 | 0.136 |
| 缓解,HAMD-17总分≤7分 | OR | 0.703 | 0.483~1.023 | 0.066 |
| 4周时间×NLR | β | 0.442 | 0.120~0.764 | 0.007 |
| 8周时间×NLR | β | 0.635 | 0.311~0.960 | <0.001 |
| 8周HAMD-17总分样条非线性 | F检验 | - | - | 0.217 |
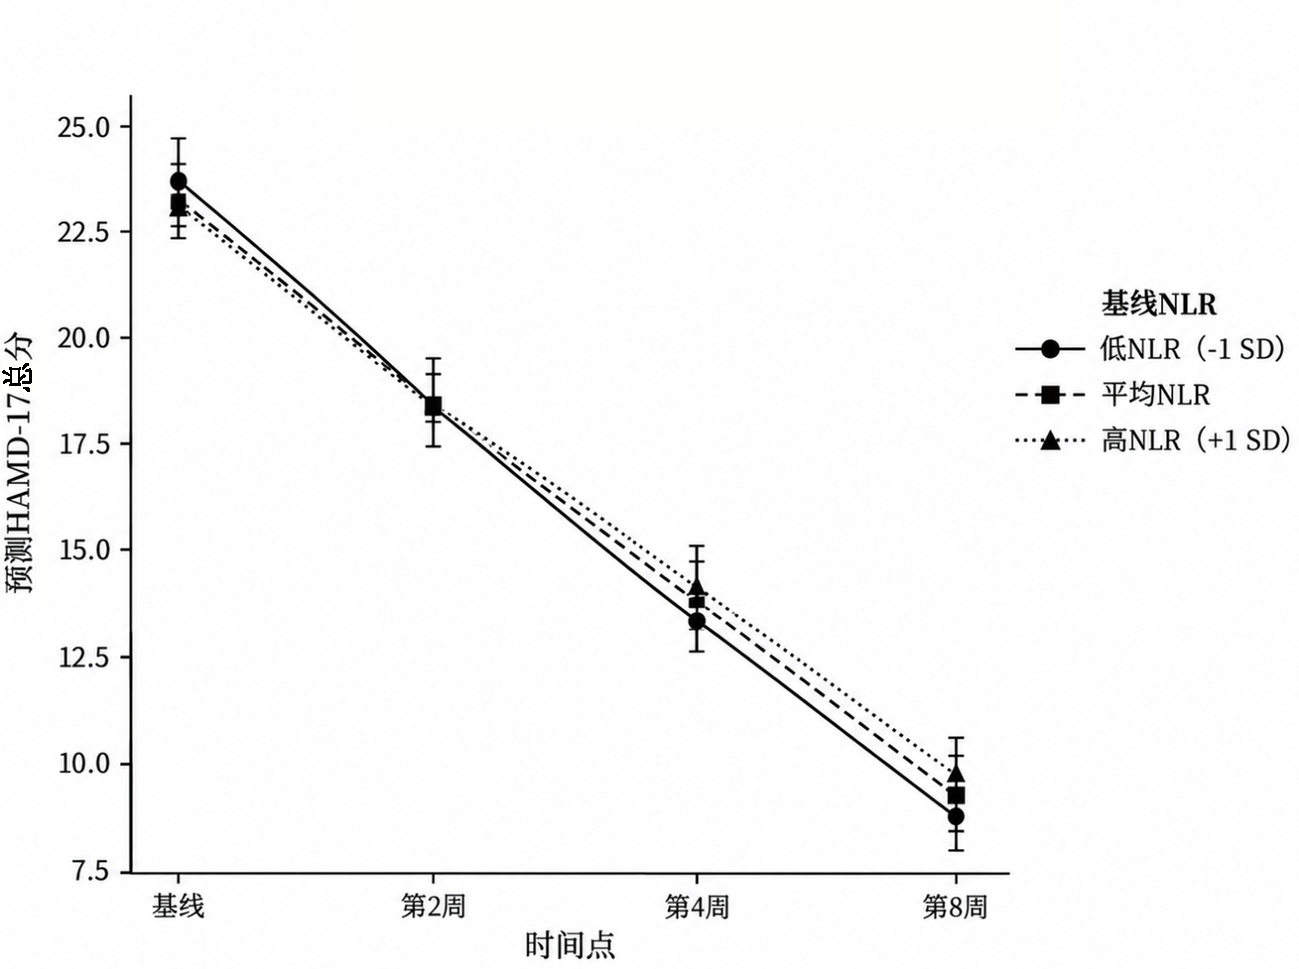
Fig. 4 Adjusted longitudinal trajectories of HAMD-17 scores at different baseline NLR levels
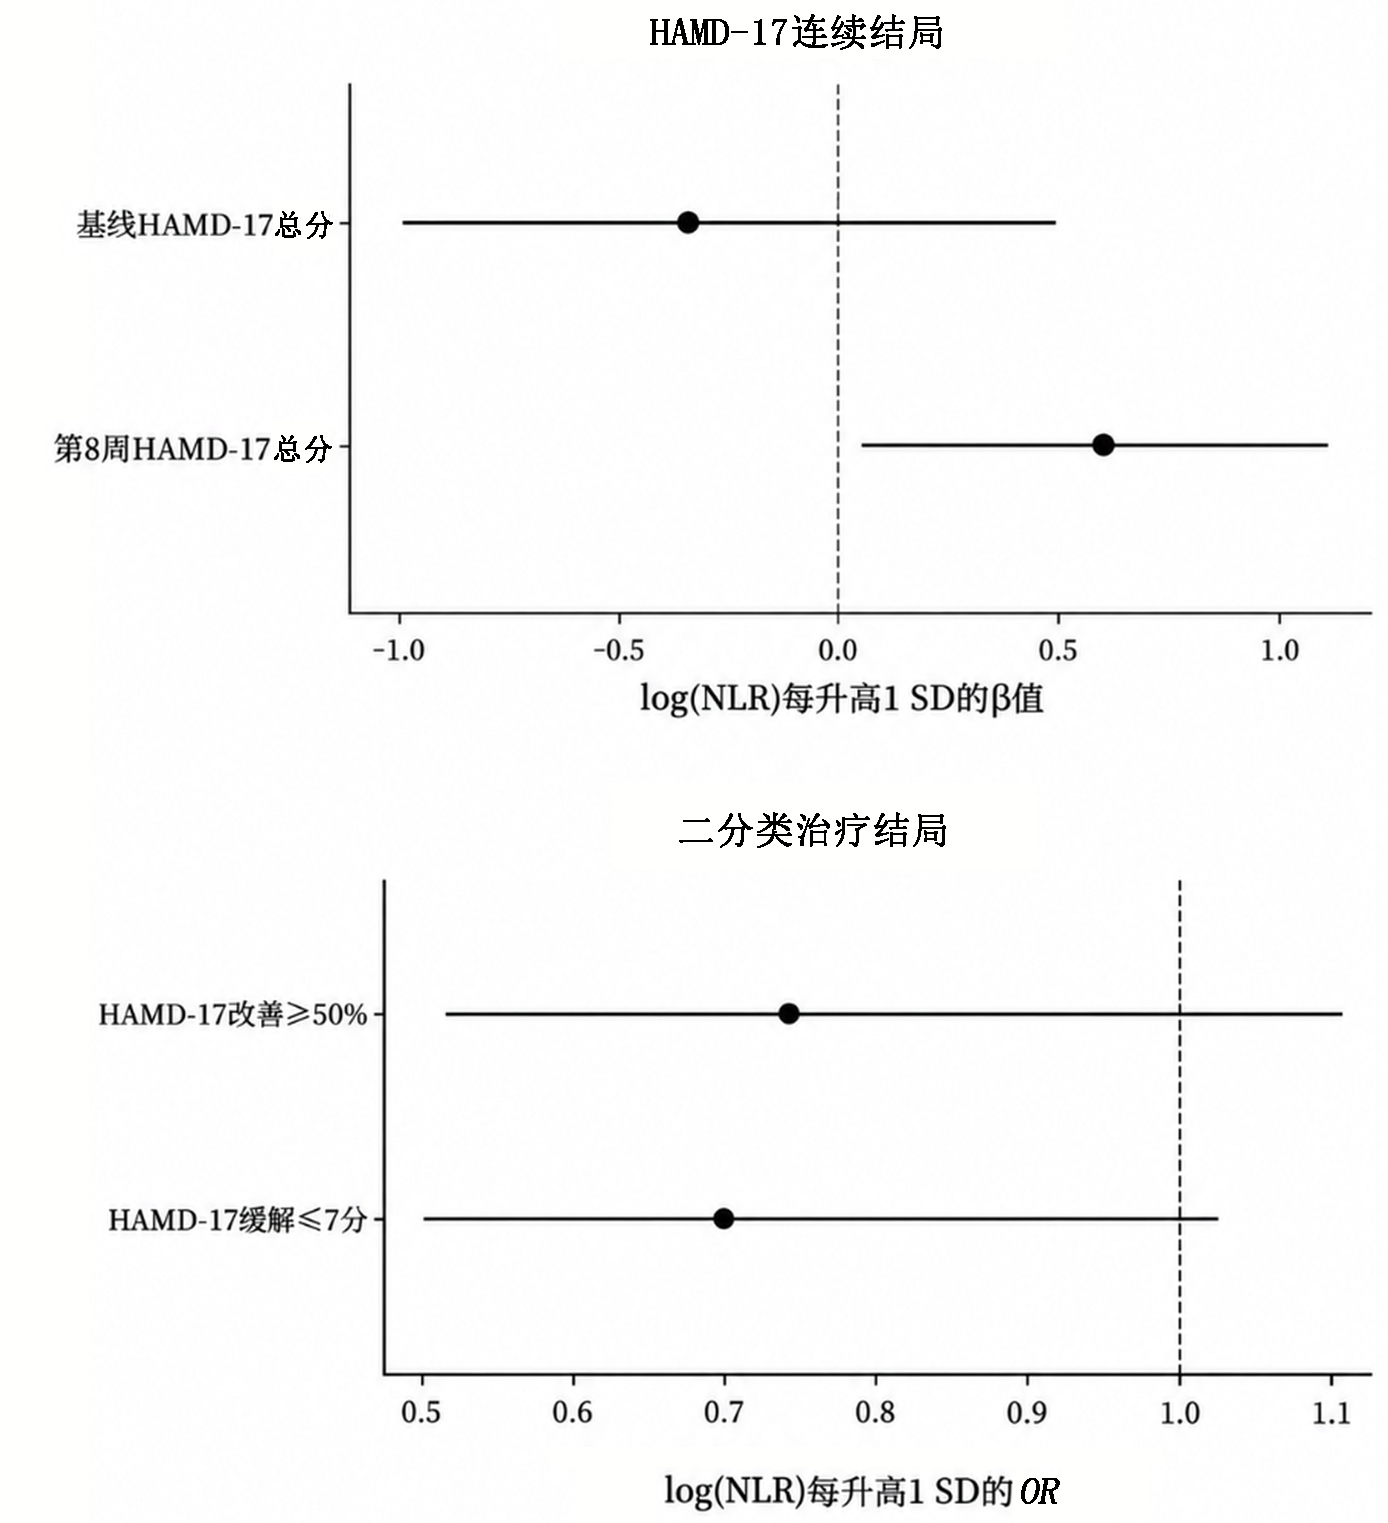
Fig. 5 Associations of baseline standardized log(NLR) with continuous and binary HAMD-17 outcomes
| 分析 | 估计值/增量 | 95%CI | P值 | 例数 |
|---|---|---|---|---|
| 扩展条件模型 | 0.613 | 0.105~1.121 | 0.018 | 300 |
| 排除急性/炎症相关情况 | 0.554 | -0.060~1.167 | 0.077 | 256 |
| 依从性≥80% | 0.334 | -0.225~0.893 | 0.240 | 251 |
| 无rTMS或ECT | 0.682 | 0.145~1.219 | 0.013 | 244 |
| 同一HAMD-17评分者 | 0.651 | 0.057~1.246 | 0.032 | 219 |
| CBC距治疗开始≤3 d | 0.744 | 0.096~1.393 | 0.025 | 155 |
| IPCW | 0.594 | 0.060~1.129 | 0.029 | 300 |
| 多重插补 | 0.566 | 0.061~1.072 | 0.028 | 320 |
| 重复CBC:基线NLR | 0.787 | 0.071~1.503 | 0.032 | 169 |
| 重复CBC:NLR变化 | -0.248 | -1.099~0.602 | 0.565 | 169 |
| 加入NLR:调整R2增量 | 0.0063 | - | 0.049 | 300 |
| 加入NLR:AUC增量 | 0.0078 | - | 0.550 | 300 |
Tab.5 Robustness and incremental model performance analyses of the hospital-based cohort
| 分析 | 估计值/增量 | 95%CI | P值 | 例数 |
|---|---|---|---|---|
| 扩展条件模型 | 0.613 | 0.105~1.121 | 0.018 | 300 |
| 排除急性/炎症相关情况 | 0.554 | -0.060~1.167 | 0.077 | 256 |
| 依从性≥80% | 0.334 | -0.225~0.893 | 0.240 | 251 |
| 无rTMS或ECT | 0.682 | 0.145~1.219 | 0.013 | 244 |
| 同一HAMD-17评分者 | 0.651 | 0.057~1.246 | 0.032 | 219 |
| CBC距治疗开始≤3 d | 0.744 | 0.096~1.393 | 0.025 | 155 |
| IPCW | 0.594 | 0.060~1.129 | 0.029 | 300 |
| 多重插补 | 0.566 | 0.061~1.072 | 0.028 | 320 |
| 重复CBC:基线NLR | 0.787 | 0.071~1.503 | 0.032 | 169 |
| 重复CBC:NLR变化 | -0.248 | -1.099~0.602 | 0.565 | 169 |
| 加入NLR:调整R2增量 | 0.0063 | - | 0.049 | 300 |
| 加入NLR:AUC增量 | 0.0078 | - | 0.550 | 300 |
| [1] | Qin K, Wei Q. Global and regional burden of major depressive disorder and associated risk factors: Analysis from the Global Burden of Disease Study, 1990-2021[J]. Eur Arch Psychiatry Clin Neurosci, 2026, 276(5):2509-2520. doi:10.1007/s00406-026-02265-3. |
| [2] | Yan G, Zhang Y, Wang S, et al. Global, regional, and national temporal trend in burden of major depressive disorder from 1990 to 2019: An analysis of the Global Burden of Disease Study[J]. Psychiatry Res, 2024, 337:115958. doi:10.1016/j.psychres.2024.115958. |
| [3] |
Santomauro DF, Vos T, Whiteford HA, et al. Service coverage for major depressive disorder: Estimated rates of minimally adequate treatment for 204 countries and territories in 2021[J]. Lancet Psychiatry, 2024, 11(12):1012-1021. doi:10.1016/S2215-0366(24)00317-1.
pmid: 39572105 |
| [4] |
Marx W, Penninx BWJH, Solmi M, et al. Major depressive disorder[J]. Nat Rev Dis Primers, 2023, 9(1):44. doi:10.1038/s41572-023-00454-1.
pmid: 37620370 |
| [5] | Cui L, Li S, Wang S, et al. Major depressive disorder: Hypothesis, mechanism, prevention and treatment[J]. Signal Transduct Target Ther, 2024, 9(1):30. doi:10.1038/s41392-024-01738-y. |
| [6] | Réus GZ, Manosso LM, Quevedo J, et al. Major depressive disorder as a neuro-immune disorder: Origin, mechanisms, and therapeutic opportunities[J]. Neurosci Biobehav Rev, 2023, 155:105425. doi:10.1016/j.neubiorev.2023.105425. |
| [7] |
Kuring JK, Mathias JL, Ward L, et al. Inflammatory markers in persons with clinically-significant depression, anxiety or PTSD: A systematic review and meta-analysis[J]. J Psychiatr Res, 2023, 168:279-292. doi:10.1016/j.jpsychires.2023.10.009.
pmid: 37931509 |
| [8] | Ang SH, Ho RC, McIntyre RS, et al. The clinical utility of biomarkers in diagnosing major depressive disorder in adults: A systematic review of literature from 2013 to 2023[J]. Psychiatry Investig, 2025, 22(4):341-356. doi:10.30773/pi.2024.0152. |
| [9] | Zhou Y, Jiang X, Hu Y, et al. The relationship between neutrophil-to-lymphocyte ratio and the prevalence and clinical outcomes of depressive disorders: A systematic review and meta-analysis[J]. Harv Rev Psychiatry, 2025, 33(6):289-304. doi:10.1097/HRP.0000000000000444. |
| [10] |
Ninla-Aesong P, Kietdumrongwong P, Neupane SP, et al. Relative value of novel systemic immune-inflammatory indices and classical hematological parameters in predicting depression, suicide attempts and treatment response[J]. Sci Rep, 2024, 14(1):19018. doi:10.1038/s41598-024-70097-z.
pmid: 39152198 |
| [11] |
Paolini M, Harrington Y, Raffaelli L, et al. Neutrophil to lymphocyte ratio and antidepressant treatment response in patients with major depressive disorder: Effect of sex and hippocampal volume[J]. Eur Neuropsychopharmacol, 2023, 76:52-60. doi:10.1016/j.euroneuro.2023.07.010.
pmid: 37544076 |
| [12] | Koparal B, Temizkan HN, Aksu MH, et al. Higher neutrophil-lymphocyte ratio predicts poor response to repetitive transcranial magnetic stimulation (rTMS) in treatment resistant depression[J]. Eur Arch Psychiatry Clin Neurosci, 2025, 275(8):2547-2555. doi:10.1007/s00406-025-01977-2. |
| [13] | Zheng Y, Yin K, Li L, et al. Association between immune-inflammation-based prognostic index and depression: An exploratory cross-sectional analysis of NHANES data[J]. J Affect Disord, 2024, 362:75-85. doi:10.1016/j.jad.2024.06.103. |
| [14] |
Liu D, He C, Luo X. Relationship between systemic immune-inflammation index and depression among individuals with and without cardiovascular disease[J]. J Cardiothorac Surg, 2025, 20(1):15. doi:10.1186/s13019-024-03314-5.
pmid: 39755660 |
| [15] | Duan J, Chen J, Xiang Z. The U-shape relationship between the aggregate index of systemic inflammation and depression in American adults: A cross-sectional study[J]. J Affect Disord, 2025, 380:270-278. doi:10.1016/j.jad.2025.03.139. |
| [16] | Zhou K, Xie Y, Xie X, et al. U-shaped association between systemic immune-inflammatory index and depression in U.S. adults with hypertension[J]. J Affect Disord, 2025, 386:119437. doi:10.1016/j.jad.2025.119437. |
| [17] | von Elm E, Altman DG, Egger M, et al. The strengthening the reporting of observational studies in epidemiology statement: Guidelines for reporting observational studies[J]. PLoS Med, 2007, 4(10):e296. doi:10.1371/journal.pmed.0040296. |
| [18] |
Kroenke K, Spitzer RL, Williams JBW. The PHQ-9: Validity of a brief depression severity measure[J]. J Gen Intern Med, 2001, 16(9):606-613. doi:10.1046/j.1525-1497.2001.016009606.x.
pmid: 11556941 |
| [19] | Inker LA, Eneanya ND, Coresh J, et al. New creatinine- and cystatin C-based equations to estimate GFR without race[J]. N Engl J Med, 2021, 385(19):1737-1749. doi:10.1056/NEJMoa2102953. |
| [20] | Hamilton M. A rating scale for depression[J]. J Neurol Neurosurg Psychiatry, 1960, 23(1):56-62. doi:10.1136/jnnp.23.1.56. |
| [21] | Benjamini Y, Hochberg Y. Controlling the false discovery rate: A practical and powerful approach to multiple testing[J]. J R Stat Soc Series B, 1995, 57(1):289-300. doi:10.1111/j.2517-6161.1995.tb02031.x. |
| [22] |
Durrleman S, Simon R. Flexible regression models with cubic splines[J]. Stat Med, 1989, 8(5):551-561. doi:10.1002/sim.4780080504.
pmid: 2657958 |
| [23] |
White IR, Royston P, Wood AM. Multiple imputation using chained equations: Issues and guidance for practice[J]. Stat Med, 2011, 30(4):377-399. doi:10.1002/sim.4067.
pmid: 21225900 |
| [24] | Zeileis A. Econometric computing with HC and HAC covariance matrix estimators[J]. J Stat Softw, 2004, 11(10):1-17. doi:10.18637/jss.v011.i10. |
| [25] | Bates D, Mächler M, Bolker B, et al. Fitting linear mixed-effects models using lme4[J]. J Stat Softw, 2015, 67(1):1-48. doi:10.18637/jss.v067.i01. |
| [26] | Meng F, Yan X, Qi J, et al. Association of neutrophil to lymphocyte ratio, platelet to lymphocyte ratio, and monocyte to lymphocyte ratio with depression: A cross-sectional analysis of the NHANES data[J]. J Affect Disord, 2022, 315:168-173. doi:10.1016/j.jad.2022.08.004. |
| [27] |
Canli D. Evaluation of systemic immune inflammation index and neutrophil-to-lymphocyte ratio in schizophrenia, bipolar disorder and depression[J]. Bratisl Lek Listy, 2024, 125(8):472-476. doi:10.4149/BLL_2024_73.
pmid: 38989747 |
| [28] | Schumacher A, Tu E, Albaum C, et al. The systemic immune-inflammation index (SII) as a biomarker for depression in a community sample of adolescents[J]. Compr Psychoneuroendocrinol, 2025, 23:100302. doi:10.1016/j.cpnec.2025.100302. |
| [29] | Baxter L, Utulu N, Utulu F, et al. An umbrella review of inflammatory biomarkers and their relationship to treatment response in MDD[J]. NeurosciBiobehav Rev, 2026, 188:106806. doi:10.1016/j.neubiorev.2026.106806. |
| [30] | Chun HW, Park YE, Kim JH, et al. Peripheral inflammatory biomarkers as predictors of antidepressant treatment response in major depressive disorder: An updated systematic review and meta-analysis[J]. Psychopharmacol Bull, 2026, 56(4Suppl 1): 88-107. doi:10.64719/pb.20776. |
| [31] | Pastuszak M, Cubała WJ, Kwa'sny A, et al. The search for consistency in residual symptoms in major depressive disorder: A narrative review[J]. J Pers Med, 2024, 14(8):828. doi:10.3390/jpm14080828. |
| [32] | Křenek P, Hořínková J, Bartečků E. Peripheral inflammatory markers in subtypes and core features of depression: A systematized review[J]. Psychopathology, 2023, 56(5):403-416. doi:10.1159/000528907. |
| Viewed | ||||||
|
Full text |
|
|||||
|
Abstract |
|
|||||