
临床荟萃 ›› 2026, Vol. 41 ›› Issue (9): 794-806.doi: 10.3969/j.issn.1004-583X.2026.09.003
谢士樑1,2a, 王心瑜3, 赵龙4, 孙蕊心2b( )
收稿日期:2026-05-20
出版日期:2026-09-20
发布日期:2026-09-17
通讯作者:
孙蕊心
E-mail:sunruixin@tongji.edu.cn
基金资助:
Xie Shiliang1,2a, Wang Xinyu3, Zhao Long4, Sun Ruixin2b()
Received:2026-05-20
Online:2026-09-20
Published:2026-09-17
Contact:
Sun Ruixin
E-mail:sunruixin@tongji.edu.cn
摘要:
目的 初步探讨恶性肺结节、良性肺结节及健康人群的肠道菌群差异性及代谢通路变化。方法 本研究采用小样本、初步探索性研究设计。选取2024年8-12月就诊于上海市同济医院的肺结节患者31例,依据结节良恶性,分为恶性肺结节组(n=23)和良性肺结节组(n=8),同时选取健康人群(健康人群组)14例。采用16S核糖体RNA测序技术,分析3组菌群多样性、物种丰度、群落结构及代谢功能差异。结果 α多样性显示,在物种丰富度方面,恶性肺结节组与良性肺结节组、良性肺结节组与健康人群组的基于丰度的覆盖度估计指数差异均有统计学意义(P<0.05),在群落均匀度及多样性上,恶性肺结节组及良性肺结节组较健康人群组Shannon和Simpson指数均降低(P<0.05)。β多样性分析显示,3组群落宏观结构整体差异有统计学意义(P<0.05),其中,恶性肺结节组呈现出偏离健康稳态的独立聚集趋势,而良性肺结节组与健康人群组的群落结构存在部分重叠与趋同。线性判别分析效应大小差异分析显示,3组间的生物标志物呈现显著的病理级联分化(LDA>3.0,P<0.05)。恶性肺结节组特异性暴发富集了条件致病菌变形菌门(Proteobacteria)及其下属的γ-变形菌纲(Gammaproteobacteria)、肠杆菌科(Enterobacteriaceae)和埃希氏菌-志贺氏菌属(Escherichia-Shigella);与之相反,良性肺结节组则展现出以放线菌门(Actinobacteriota)及双歧杆菌属(Bifidobacterium)富集为核心的益生菌防御模式。菌群Spearman相关性网络表明,群落失调并非孤立事件,而是由于条件致病菌与核心有益共生菌之间强烈的拮抗竞争所驱动。京都基因与基因组百科全书功能预测两两比较显示,3组人群的肠道菌群的多条特异性代谢通路差异有统计学意义(P<0.05)。结论 恶性肺结节患者与健康人群肠道菌群组成差异有统计学意义,恶性肺结节组、良性肺结节组和健康人群组存在差异性代谢通路,可为肺癌的诊断和治疗提供新生物标志物及策略。
中图分类号:
谢士樑, 王心瑜, 赵龙, 孙蕊心. 良恶性肺结节患者及健康人的肠道菌群差异性[J]. 临床荟萃, 2026, 41(9): 794-806.
Xie Shiliang, Wang Xinyu, Zhao Long, Sun Ruixin. Differences in the gut microbiota among patients with benign and malignant pulmonary nodules and healthy individuals[J]. Clinical Focus, 2026, 41(9): 794-806.
| 项目 | 恶性肺结节组 (n=23) | 良性肺结节组 (n=8) | 健康人群组 (n=14) | χ2/H值 | P值 |
|---|---|---|---|---|---|
| 年龄(岁) | 68.0(58.0, 74.0)* | 59.5(55.0, 65.5) | 50.5(42.0, 61.8) | 9.615 | 0.008 |
| 男性[例(%)] | 13(56.5) | 4(50.0) | 7(50.0) | 0.192 | 0.908 |
| 体质量指数(kg/m2) | 24.02(21.18, 25.72) | 24.87(21.05, 26.95) | 23.84(23.37, 26.51) | 1.004 | 0.606 |
| 吸烟史[例(%)] | 5(21.7) | 2(25.0) | 4(28.6) | 0.222 | 0.895 |
| 饮酒史[例(%)] | 2(8.7) | 1(12.5) | 2(14.3) | 0.294 | 0.863 |
| 合并基础疾病[例(%)] | 9(39.1) | 1(12.5) | 3(21.4) | 2.600 | 0.273 |
| 结节最大径[例(%)] | |||||
| ≤1.0 cm | 11(47.8) | - | - | - | - |
| >1.0 cm | 12(52.2) | - | - | - | - |
| 分化程度[例(%)] | |||||
| 高分化 | 12(52.2) | - | - | - | - |
| 中分化 | 7(30.4) | - | - | - | - |
| 低分化 | 4(17.4) | - | - | - | - |
| 有无淋巴结转移[例(%)] | |||||
| 有 | 0 | - | - | - | - |
| 无 | 23(100.0) | - | - | - | - |
表1 3组基线资料及恶性肺结节组临床分层
Tab.1 Baseline characteristics of the three groups and clinical stratification of the malignant pulmonary nodule group
| 项目 | 恶性肺结节组 (n=23) | 良性肺结节组 (n=8) | 健康人群组 (n=14) | χ2/H值 | P值 |
|---|---|---|---|---|---|
| 年龄(岁) | 68.0(58.0, 74.0)* | 59.5(55.0, 65.5) | 50.5(42.0, 61.8) | 9.615 | 0.008 |
| 男性[例(%)] | 13(56.5) | 4(50.0) | 7(50.0) | 0.192 | 0.908 |
| 体质量指数(kg/m2) | 24.02(21.18, 25.72) | 24.87(21.05, 26.95) | 23.84(23.37, 26.51) | 1.004 | 0.606 |
| 吸烟史[例(%)] | 5(21.7) | 2(25.0) | 4(28.6) | 0.222 | 0.895 |
| 饮酒史[例(%)] | 2(8.7) | 1(12.5) | 2(14.3) | 0.294 | 0.863 |
| 合并基础疾病[例(%)] | 9(39.1) | 1(12.5) | 3(21.4) | 2.600 | 0.273 |
| 结节最大径[例(%)] | |||||
| ≤1.0 cm | 11(47.8) | - | - | - | - |
| >1.0 cm | 12(52.2) | - | - | - | - |
| 分化程度[例(%)] | |||||
| 高分化 | 12(52.2) | - | - | - | - |
| 中分化 | 7(30.4) | - | - | - | - |
| 低分化 | 4(17.4) | - | - | - | - |
| 有无淋巴结转移[例(%)] | |||||
| 有 | 0 | - | - | - | - |
| 无 | 23(100.0) | - | - | - | - |
| 病理分型 | 例数 | CEA(μg/L) | NSE(μg/L) | CYFRA21-1(μg/L) | SCCA(μg/L) |
|---|---|---|---|---|---|
| 腺癌 | 18 | 2.885(2.145, 4.660) | 12.000(11.200, 16.650) | 2.280(1.768, 2.700) | 1.105(0.843, 1.458) |
| 非腺癌 | 5 | 2.410(0.970, 2.740) | 11.000(9.130, 13.100) | 3.370(2.880, 4.170) | 2.110(0.820, 3.070) |
| Z值 | -1.342 | -0.895 | -1.715 | -1.006 | |
| P值 | 0.180 | 0.371 | 0.086 | 0.314 |
表2 腺癌与非腺癌患者血清标志物水平对比
Tab.2 Comparison of serum biomarker levels between patients with adenocarcinoma and non-adenocarcinoma
| 病理分型 | 例数 | CEA(μg/L) | NSE(μg/L) | CYFRA21-1(μg/L) | SCCA(μg/L) |
|---|---|---|---|---|---|
| 腺癌 | 18 | 2.885(2.145, 4.660) | 12.000(11.200, 16.650) | 2.280(1.768, 2.700) | 1.105(0.843, 1.458) |
| 非腺癌 | 5 | 2.410(0.970, 2.740) | 11.000(9.130, 13.100) | 3.370(2.880, 4.170) | 2.110(0.820, 3.070) |
| Z值 | -1.342 | -0.895 | -1.715 | -1.006 | |
| P值 | 0.180 | 0.371 | 0.086 | 0.314 |
| 病理分期 | 例数 | CEA(μg/L) | NSE(μg/L) | CYFRA21-1(μg/L) | SCCA(μg/L) |
|---|---|---|---|---|---|
| Ⅰ期 | 19 | 2.890(2.160, 4.620) | 11.600(10.800, 16.100) | 2.310(1.835, 2.765) | 1.080(0.805, 1.535) |
| Ⅱ期 | 4 | 1.745(1.052, 2.493) | 12.050(10.430, 16.950) | 3.770(2.765, 4.452) | 1.620(1.052, 2.430) |
| Z值 | -1.886 | -1.785 | -1.460 | -0.284 | |
| P值 | 0.062 | 0.074 | 0.144 | 0.776 |
表3 不同病理分期肺癌患者血清标志物水平对比
Tab.3 Comparison of serum biomarker levels among patients with lung cancer at different pathological stages
| 病理分期 | 例数 | CEA(μg/L) | NSE(μg/L) | CYFRA21-1(μg/L) | SCCA(μg/L) |
|---|---|---|---|---|---|
| Ⅰ期 | 19 | 2.890(2.160, 4.620) | 11.600(10.800, 16.100) | 2.310(1.835, 2.765) | 1.080(0.805, 1.535) |
| Ⅱ期 | 4 | 1.745(1.052, 2.493) | 12.050(10.430, 16.950) | 3.770(2.765, 4.452) | 1.620(1.052, 2.430) |
| Z值 | -1.886 | -1.785 | -1.460 | -0.284 | |
| P值 | 0.062 | 0.074 | 0.144 | 0.776 |
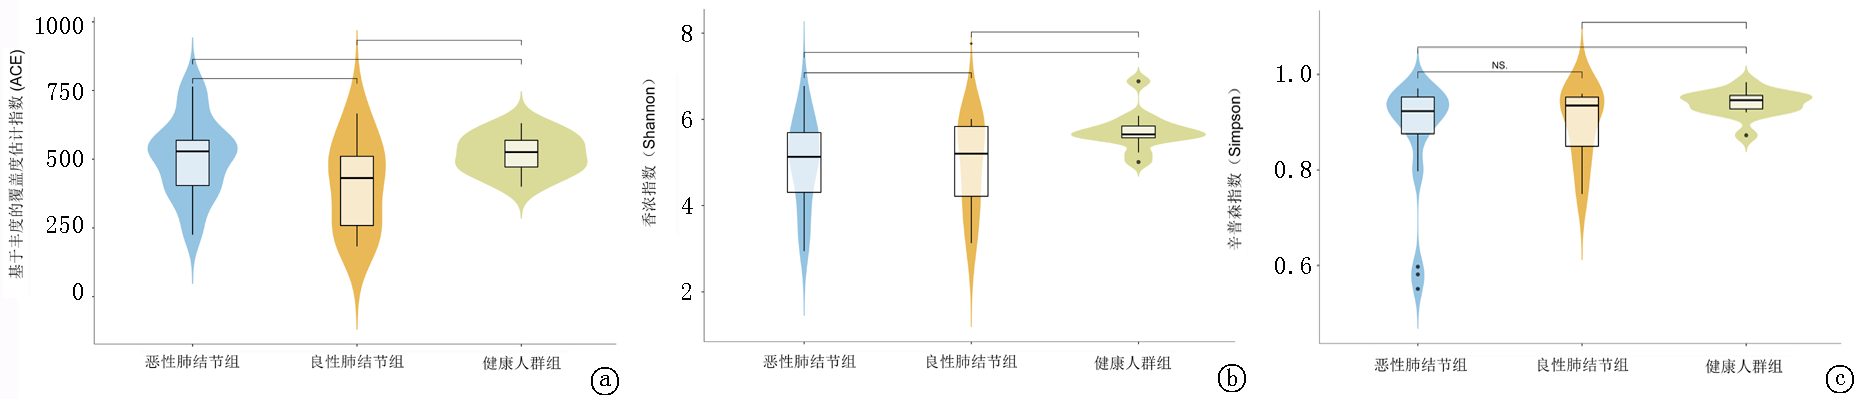
图1 3组α多样性指数图 a. ACE指数; b.Shannon指数; c.Simpson指数。注:横坐标代表组别,纵坐标代表相应的多样性指数值,上方黑线表明两组差异有统计学意义(P<0.05),标有NS的黑线表明两组差异无统计学意义(P>0.05)
Fig.1 Alpha diversity indices of the three groups a. ACE index; b. Shannon index; c. Simpson index.Note: The x-axis represents the group, and the y-axis represents the corresponding diversity index value. The black lines above the plots indicate a statistically significant difference between the two groups (P<0.05), whereas black lines labeled NS indicate no statistically significant difference between the two groups (P>0.05)
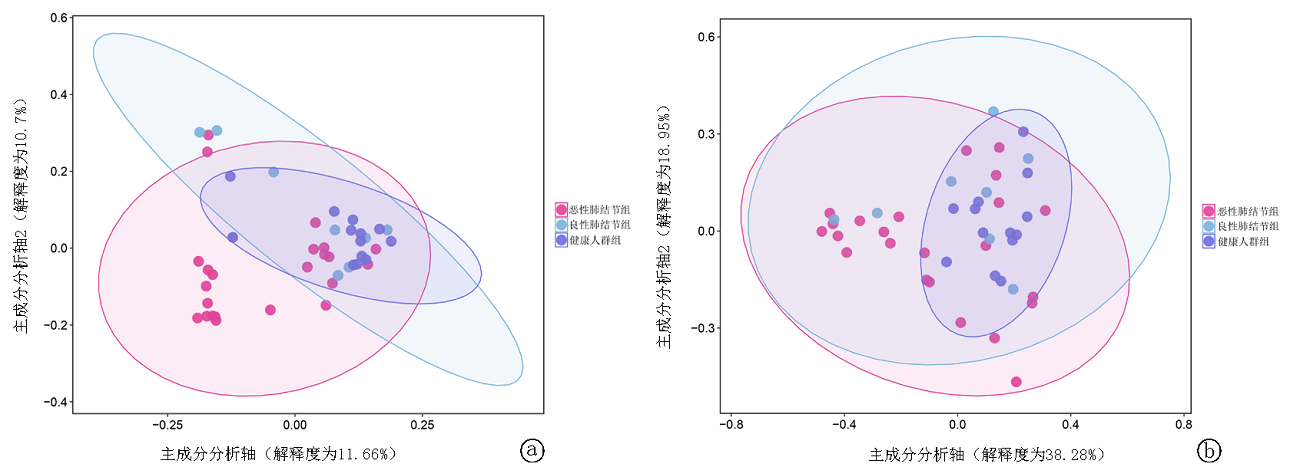
图2 3组PcoA分析图 a.非加权UniFrac 距离的PcoA,b.加权UniFrac距离的PcoA。注:横坐标表示第一主成分,纵坐标表示第二主成分,百分比表示相应主成分对样品差异的贡献值;图中的点表示各样品;不同颜色代表不同的分组;椭圆形圈表示不同分组样本的95%的可信区域
Fig.2 PCoA analysis of the three groups a. PCoA based on unweighted UniFrac distance; b. PCoA based on weighted UniFrac distance.Note: The x-axis represents the first principal component, and the y-axis represents the second principal component. The percentages indicate the contribution of the corresponding principal components to sample variation. Each dot represents a sample; different colors represent different groups; and the ellipse indicates the 95% confidence region of each group

图3 恶性肺结节组和健康人群组LefSe分析 a.LDA判别柱形图(以LDA分值绝对值>3为标准),其横坐标表示各分类单元的LDA分析的分值,纵坐标为组间差异有统计学意义的分类单元,条形图越长代表差异越显著;b.进化分支图,由内到外环为从门类到属类,不同菌级别上圆圈的直径大小与其相对含量成正比
Fig.3 LEfSe analysis of the malignant pulmonary nodule group and the healthy control group a. LDA score histogram (with |LDA score| >3 as the threshold); the x-axis indicates the LDA scores of each taxon, and the y-axis indicates the taxa with statistically significant intergroup differences; longer bars indicate more significant differences; b. Evolutionary cladogram, with the inner-to-outer rings representing taxa from phylum to genus; the diameter of each circle at different taxonomic levels is proportional to its relative abundance
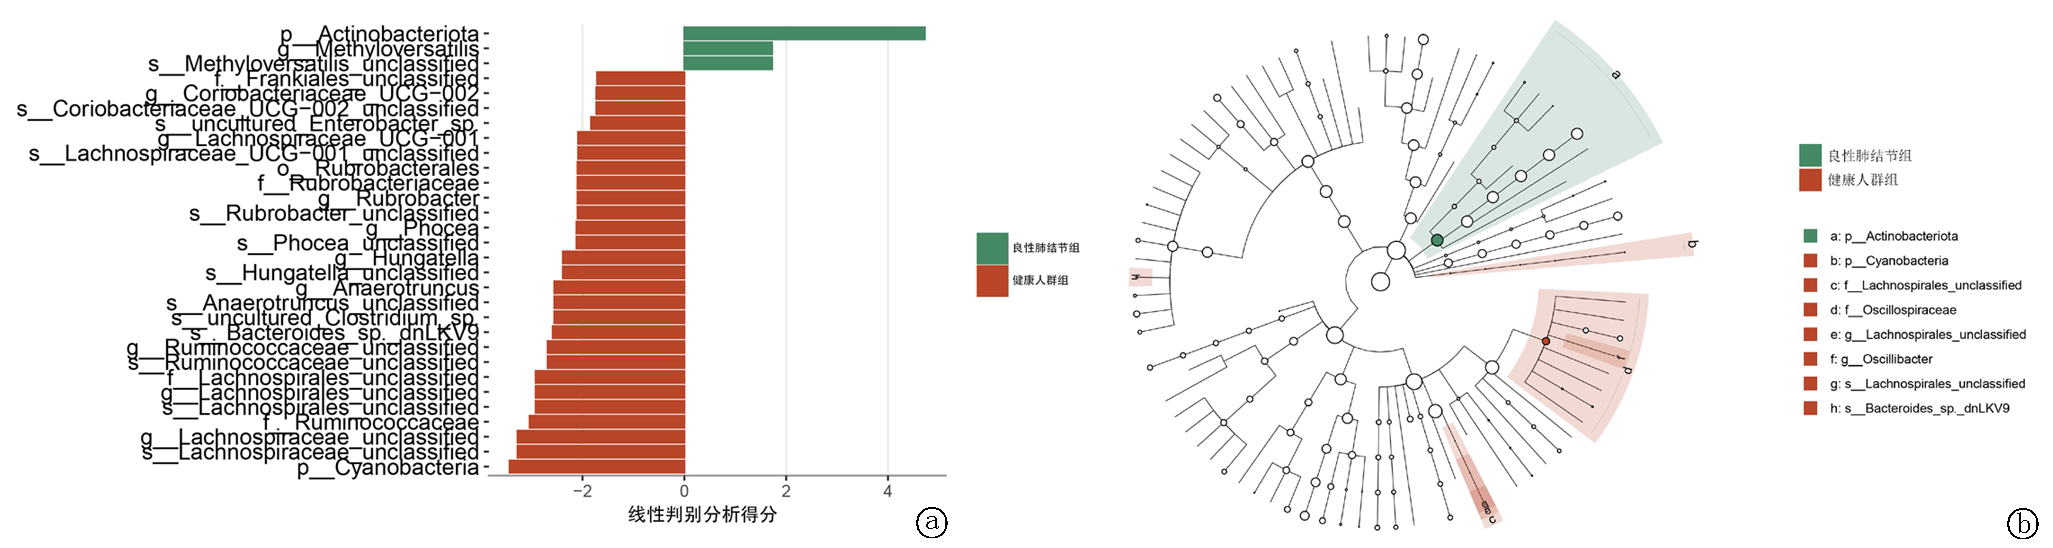
图4 良性肺结节组和健康人群组LefSe分析 a.LDA判别柱形图;b.进化分支图
Fig.4 LEfSe analysis of the benign pulmonary nodule group and the healthy control group: a. LDA score histogram; b. Evolutionary cladogram
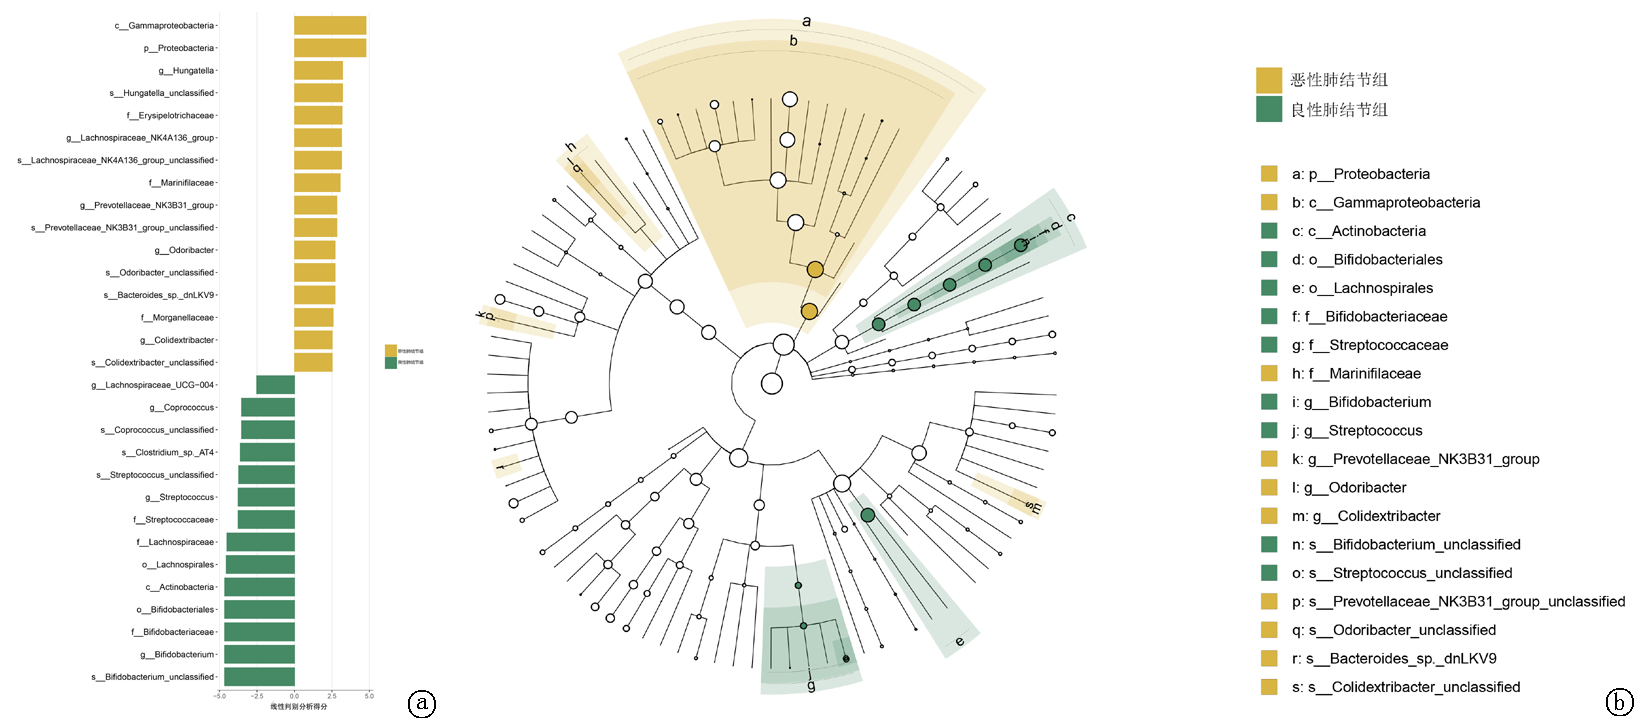
图5 恶性肺结节组和良性肺结节组LefSe分析 a.LDA判别柱形图;b.进化分支图
Fig.5 LEfSe analysis of the malignant pulmonary nodule group and the benign pulmonary nodule group a. LDA score histogram; b. Evolutionary cladogram
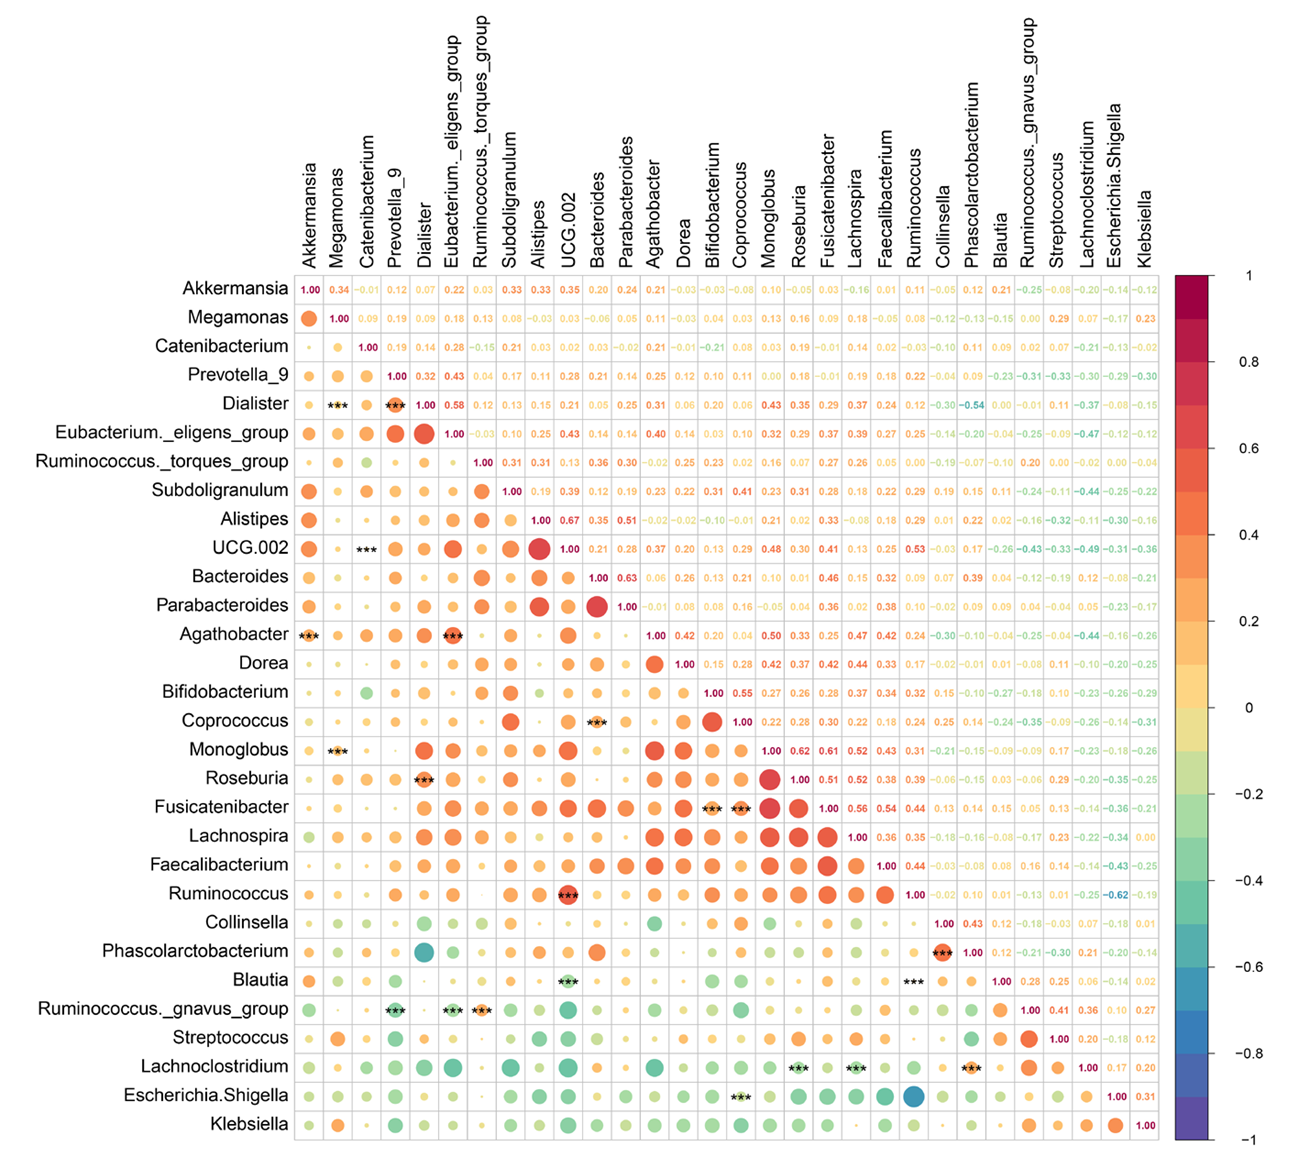
图6 属水平相关性热图 注:横轴和纵轴列出各种细菌的属名称,右侧的颜色条标注了数值,从-1~1,代表两个属之间的相关性。数值越接近-1,负相关的程度越强,数值越接近1,正相关的程度越强。***:P<0.01
Fig.6 Correlation heatmap at the genus level Note: The x-axis and y-axis list the genus names of various bacteria, and the color bar on the right indicates values ranging from -1 to 1, representing the correlation between two genera. Values closer to -1 indicate a stronger negative correlation, whereas values closer to 1 indicate a stronger positive correlation. ***: P<0.01
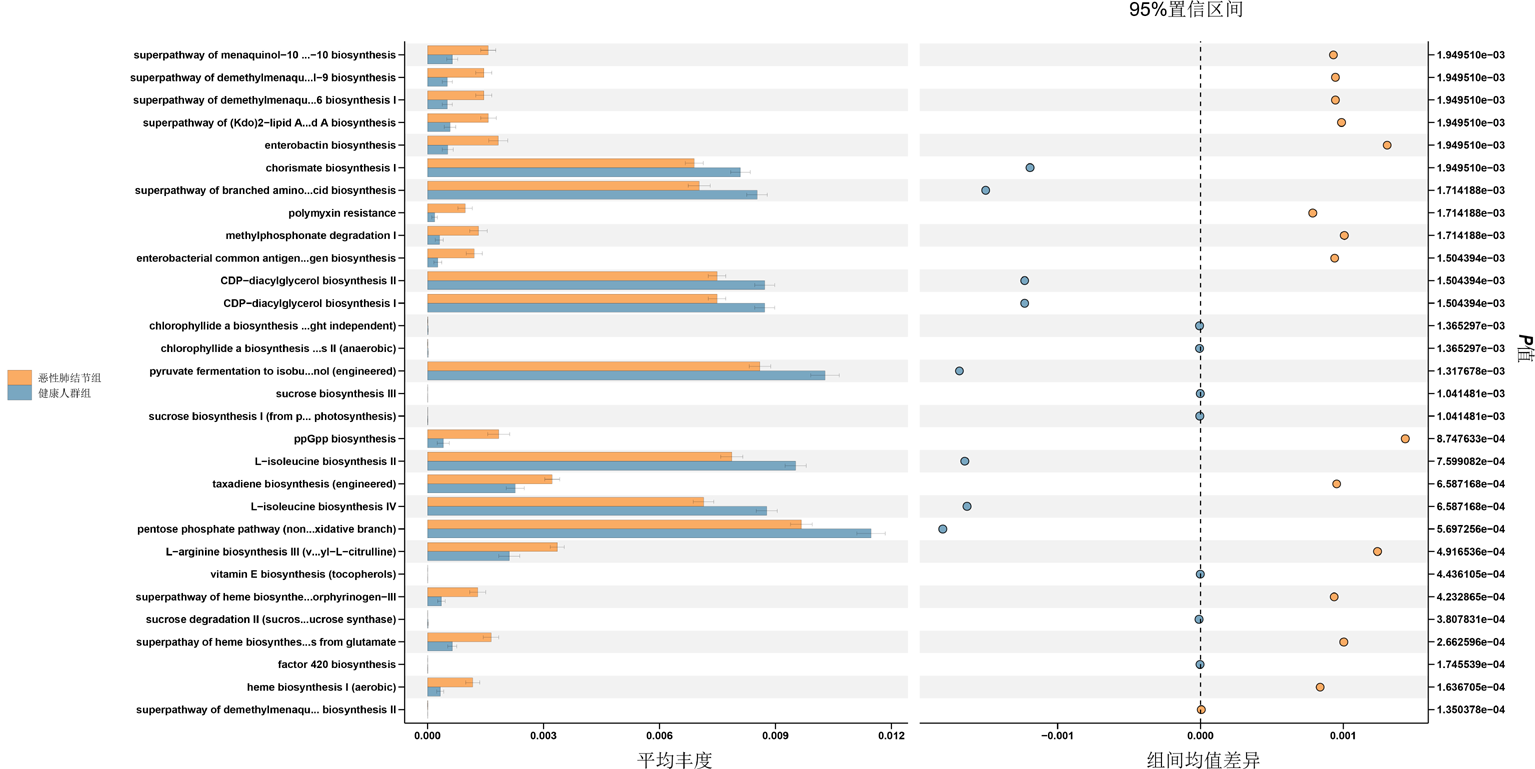
图7 恶性肺结节组和健康人群组的KEGG途径差异分析 注:横坐标为代谢通路相对丰度百分比,纵坐标为代谢通路名称;图中显示95%可信区间下的差异情况,距离中线越远,差异越大
Fig.7 Differential analysis of KEGG pathways between the malignant pulmonary nodule group and the healthy control group Note: The x-axis represents the relative abundance percentage of metabolic pathways, and the y-axis represents the pathway names. The figure shows differences under the 95% confidence interval; the farther from the center line, the greater the difference
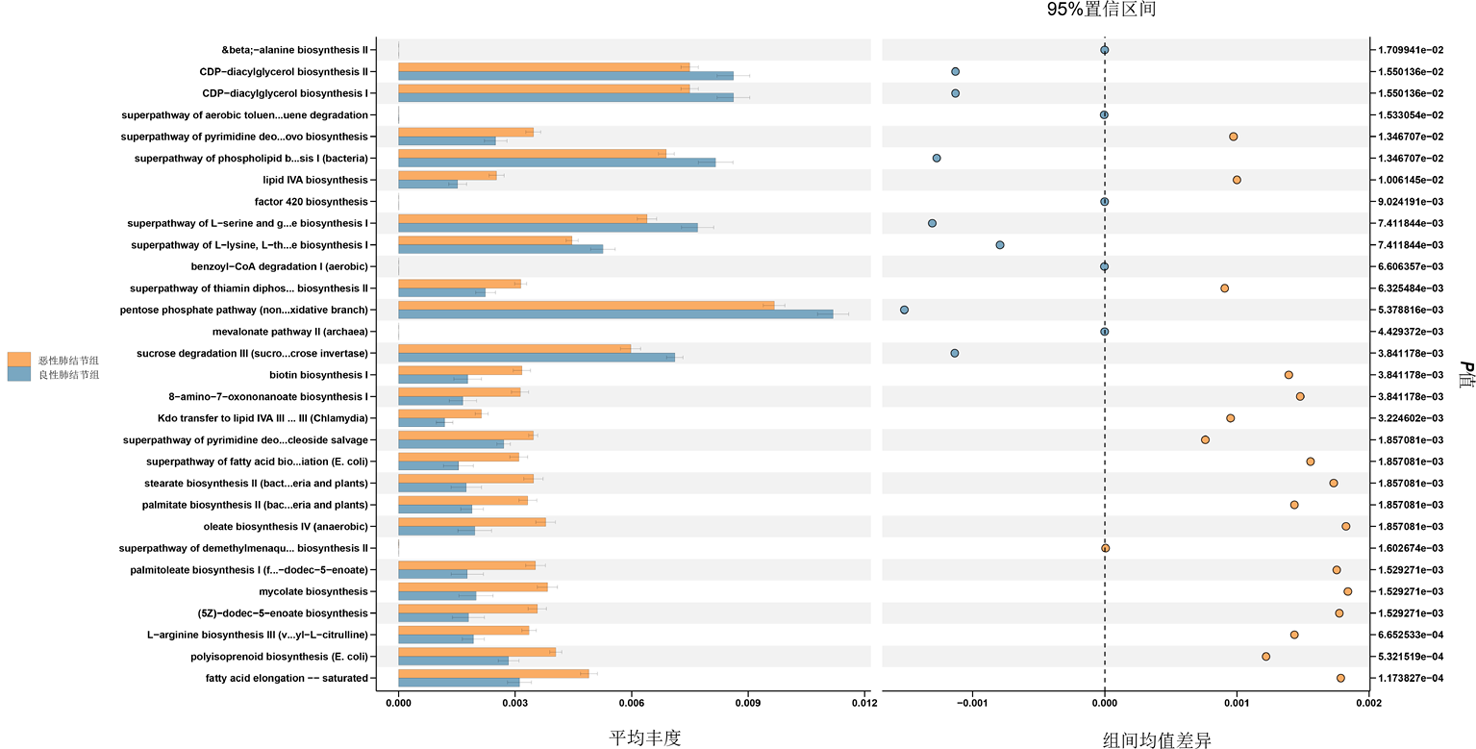
图8 恶性肺结节组和良性肺结节组KEGG途径差异
Fig.8 Differential KEGG pathways between the malignant pulmonary nodule group and the benign pulmonary nodule group
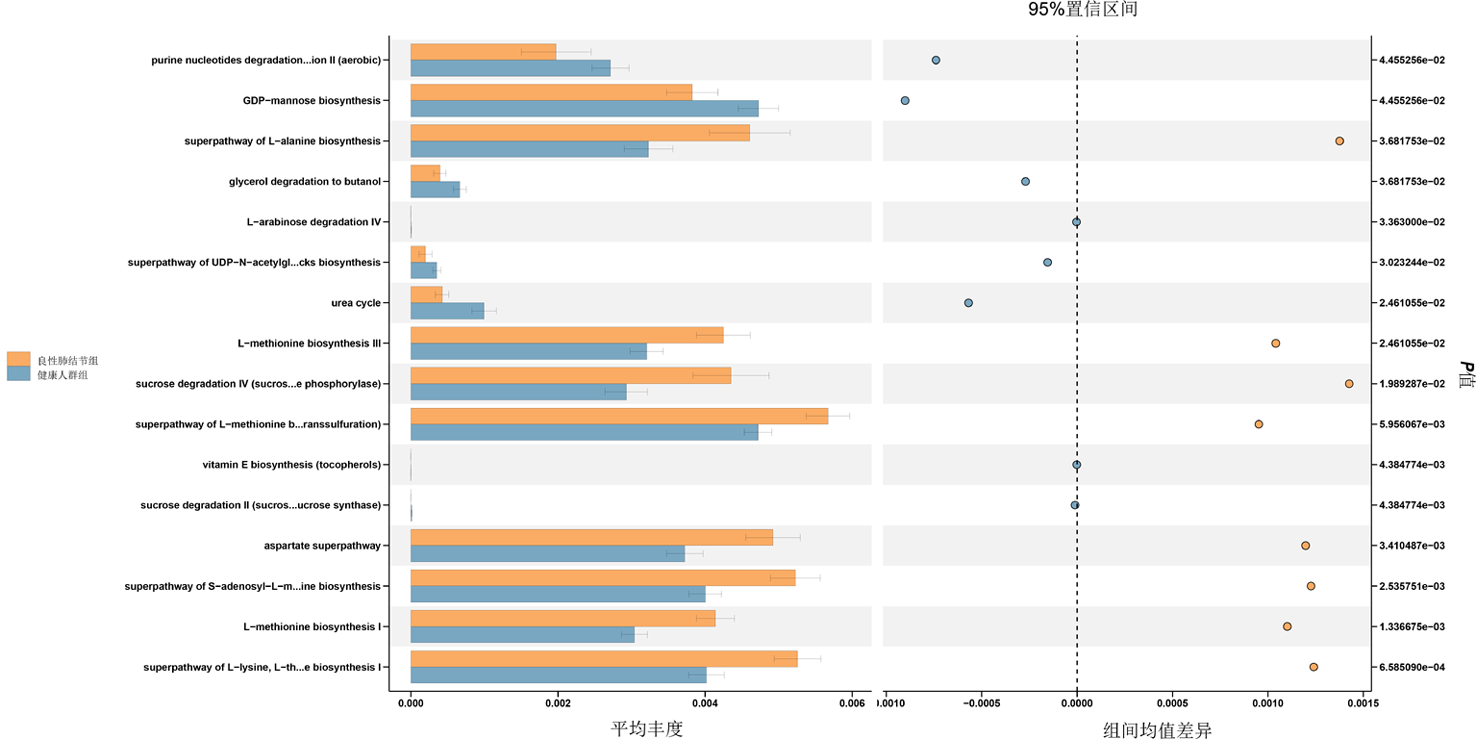
图9 良性肺结节组和健康人群组的KEGG途径差异
Fig.9 Differential KEGG pathways between the benign pulmonary nodule group and the healthy control group
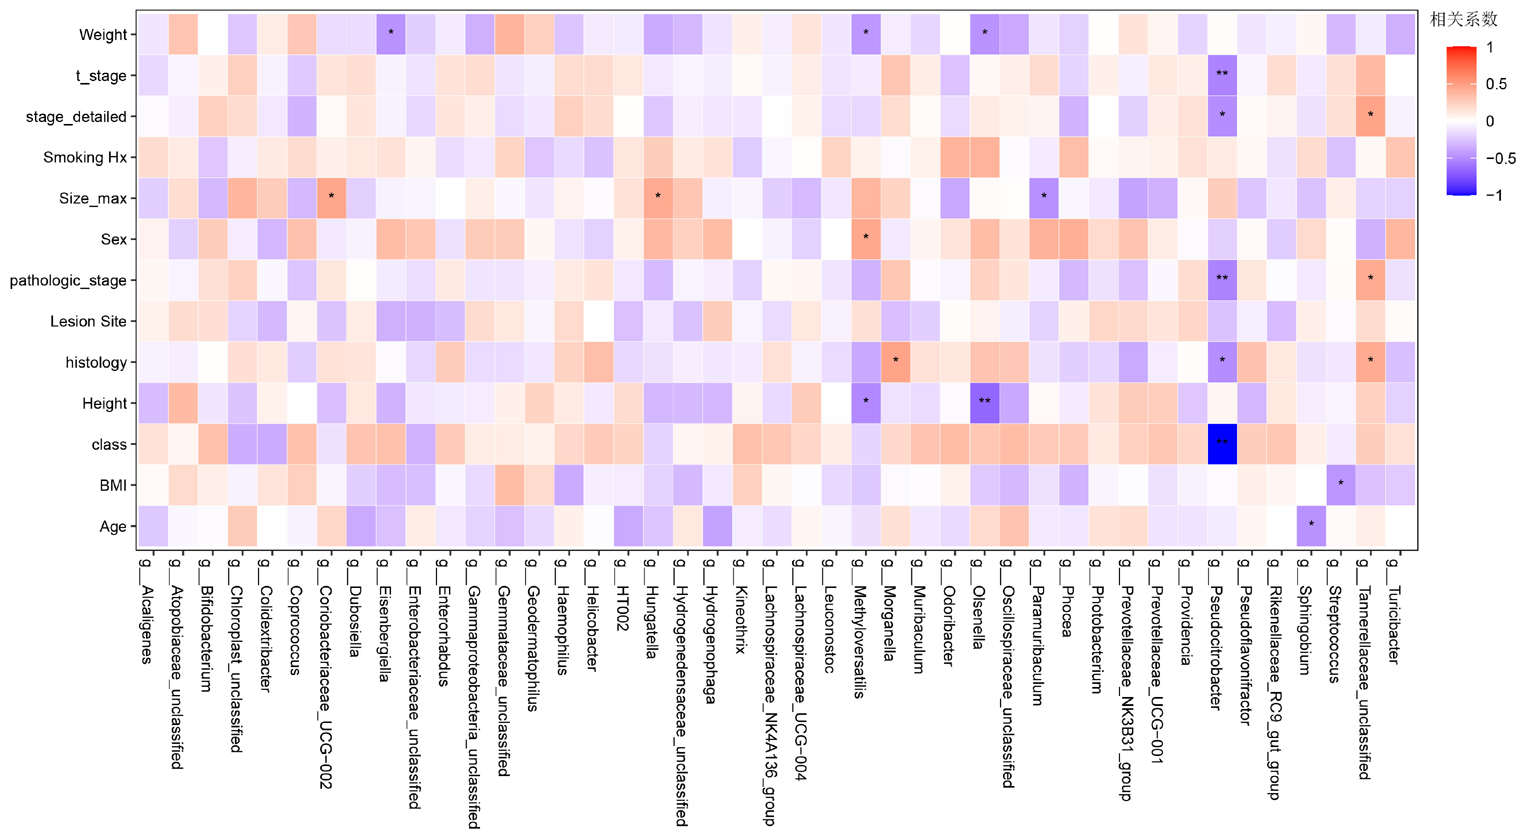
图10 临床信息热图 注:横轴为菌属名,纵轴为相关临床信息,包括:体格指标、疾病分期、临床行为、肿瘤形态及年龄等核心临床变量。相关系数越接近1(红色饱和度越高)表示正相关越强,相关系数越接近-1(蓝色饱和度越高)表示负相关越强。*:P<0.05,**:P<0.01
Fig.10 Clinical information heatmap Note: The x-axis represents bacterial genera, and the y-axis represents related clinical information, including core clinical variables such as body measurements, disease stage, clinical behavior, tumor morphology, and age. A correlation coefficient closer to 1 (higher red saturation) indicates a stronger positive correlation, whereas a correlation coefficient closer to -1 (higher blue saturation) indicates a stronger negative correlation. *:P<0.05, **: P<0.01
| [1] | Bray F, Laversanne M, Sung H, et al. Global cancer statistics 2022: GLOBOCAN estimates of incidence and mortality worldwide for 36 cancers in 185 countries[J]. CA Cancer J Clin, 2024, 74(3): 229-263. doi: 10.3322/caac.21834. |
| [2] | George JE, George PS, Krishna JKM, et al. Global trends in lung cancer incidence and mortality by age, gender and morphology and forecast: A bootstrap-based analysis[J]. Lung Cancer, 2025, 205: 108626. doi: 10.1016/j.lungcan.2024.107954. |
| [3] | Oser MG, Niederst MJ, Sequist LV, et al. Transformation from non-small-cell lung cancer to small-cell lung cancer: Molecular drivers and cells of origin[J]. Lancet Oncol, 2015, 16(4): e165-e172. doi: 10.1016/S1470-2045(14)71180-5. |
| [4] |
Thai AA, Solomon BJ, Sequist LV, et al. Lung cancer[J]. Lancet, 2021, 398(10299): 535-554. doi: 10.1016/S0140-6736(21)00124-4.
pmid: 34273294 |
| [5] | Li Y, Yan B, He S. Advances and challenges in the treatment of lung cancer[J]. Biomed Pharmacother, 2023, 169: 115891. doi: 10.1016/j.biopha.2023.115891. |
| [6] | Bi JH, Tuo JY, Xiao YX, et al. Observed and relative survival trends of lung cancer: A systematic review of population-based cancer registration data[J]. Thorac Cancer, 2024, 15(2): 142-151. doi: 10.1111/1759-7714.15163. |
| [7] |
Zhang J, Mj IJ, Oberoi J, et al. Time to diagnosis and treatment of lung cancer: A systematic overview of risk factors, interventions and impact on patient outcomes[J]. Lung Cancer, 2022, 166: 27-39. doi: 10.1016/j.lungcan.2022.01.014.
pmid: 35152171 |
| [8] | Puri N, Sahane P, Phatale V, et al. Nano-chameleons: A review on cluster of differentiation-driven immune cell-engineered nanoarchitectonics for non-small cell lung cancer[J]. Int J Biol Macromol, 2025, 310(Pt 4): 143440. doi: 10.1016/j.ijbiomac.2024.131120. |
| [9] | Duan YF, Dai JH, Lu YQ, et al. Disentangling the molecular mystery of tumour-microbiota interactions: Microbial metabolites[J]. Clin Transl Med, 2024, 14(11): e70093. doi: 10.1002/ctm2.70093. |
| [10] | Zhu B, Wang X, Li L. Human gut microbiome: the second genome of human body[J]. Protein Cell, 2010, 1(8): 718-725. doi: 10.1007/s13238-010-0093-z. |
| [11] | Khalil M, Di Ciaula A, Mahdi L, et al. Unraveling the role of the human gut microbiome in health and diseases[J]. Microorganisms, 2024, 12(11): 2154. doi: 10.3390/microorganisms12112154. |
| [12] | Islam MM, Mahbub NU, Hong ST, et al. Gut bacteria: An etiological agent in human pathological conditions[J]. Front Cell Infect Microbiol, 2024, 14: 1291148. doi: 10.3389/fcimb.2024.1291148. |
| [13] | Zhang T, Guo F, Zhang C, et al. Decoding the role of gut mycobiota in immune regulation and disease[J]. Virulence, 2025, 16(1): 2541704. doi: 10.1080/21505594.2024.2341704. |
| [14] | Lushchak VI. Symphony of digestion: coordinated host-microbiome enzymatic interplay in gut ecosystem[J]. Biomolecules, 2025, 15(8): 942. doi: 10.3390/biom15080942. |
| [15] | Cai J, Zhang W, Zhu S, et al. Gut and intratumoral microbiota: Key to lung cancer development and immunotherapy[J]. Int Immunopharmacol, 2025, 156: 114677. doi: 10.1016/j.intimp.2024.112577. |
| [16] | Smolarz B, Łukasiewicz H, Samulak D, et al. Lung cancer-epidemiology, pathogenesis, treatment and molecular aspect (review of literature)[J]. Int J Mol Sci, 2025, 26(5): 2754. doi: 10.3390/ijms26052754. |
| [17] | Ji Y, Zhang Y, Liu S, et al. The epidemiological landscape of lung cancer: Current status, temporal trend and future projections based on the latest estimates from GLOBOCAN 2022[J]. J Natl Cancer Cent, 2025, 5(3): 278-286. doi: 10.1016/j.jncc.2025.03.002. |
| [18] | Zhang R, Zhang X, Lau HCH, et al. Gut microbiota in cancer initiation, development and therapy[J]. Sci China Life Sci, 2025, 68(5): 1283-1308. doi: 10.1007/s11427-024-2451-4. |
| [19] | Min S, Zhang Y, Zhang H, et al. Gut microbiota drives cancer evolution and therapy resistance[J]. Mol Cancer, 2026, 25(1): 39. doi: 10.1186/s12943-026-01951-w. |
| [20] | Li X, Jia Y, Li Y, et al. Crosstalk between metabolic reprogramming and microbiota: Implications for cancer progression and novel therapeutic opportunities[J]. Front Immunol, 2025, 16: 1582166. doi: 10.3389/fimmu.2025.1582166. |
| [21] | Kim S, Seo SU, Kweon MN. Gut microbiota-derived metabolites tune host homeostasis fate[J]. Semin Immunopathol, 2024, 46(1-2): 2. doi: 10.1007/s00281-023-01002-3. |
| [22] | Chen Y, Xiao L, Zhou M, et al. The microbiota: A crucial mediator in gut homeostasis and colonization resistance[J]. Front Microbiol, 2024, 15: 1417864. doi: 10.3389/fmicb.2024.1417864. |
| [23] | Wang Q, Meng Q, Chen Y, et al. Interaction between gut microbiota and immunity in health and intestinal disease[J]. Front Immunol, 2025, 16: 1673852. doi: 10.3389/fimmu.2025.1673852. |
| [24] | Yu X, Yu X, Wang Y, et al. Respiratory diseases and the gut microbiota: An updated review[J]. Front Cell Infect Microbiol, 2025, 15: 1629005. doi: 10.3389/fcimb.2025.1629005. |
| [25] | Dora D, Szöcs E, Soós Á, et al. From bench to bedside: An interdisciplinary journey through the gut-lung axis with insights into lung cancer and immunotherapy[J]. Front Immunol, 2024, 15: 1434804. doi: 10.3389/fimmu.2024.1434804. |
| [26] | Hrncir T. Gut microbiota dysbiosis: Triggers, consequences, diagnostic and therapeutic options[J]. Microorganisms, 2022, 10(3): 578. doi: 10.3390/microorganisms10030578. |
| [27] |
Yang Y, Shen J, Wei S, et al. Characteristics of gut and lung microbiota in patients with lung masses and their relationship with clinical features[J]. BMC Microbiol, 2025, 25(1): 541. doi: 10.1186/s12866-025-03741-z.
pmid: 40849619 |
| [28] | Sha G, Wu Z, Wang B, et al. Intratumorally specific microbial-derived lipopolysaccharide contributes to non-small cell lung cancer progression[J]. Virulence, 2025, 16(1): 2548626. doi: 10.1080/21505594.2024.2348626. |
| [29] | Xu T, Wu X, Liu J, et al. The regulatory roles of dietary fibers on host health via gut microbiota-derived short chain fatty acids[J]. Curr Opin Pharmacol, 2022, 62: 36-42. doi: 10.1016/j.coph.2021.11.001. |
| [30] |
Rahal Z, Liu Y, Peng F, et al. Inflammation mediated by gut microbiome alterations promotes lung cancer development and an immunosuppressed tumor microenvironment[J]. Cancer Immunol Res, 2024, 12(12): 1736-1752. doi: 10.1158/2326-6066.CIR-24-0312.
pmid: 39269772 |
| [31] | Matoba R, Iijima H, Sakamoto Y, et al. Metabolic and functional pathways of gut microbiota in patients with gastric cancer[J]. Sci Rep, 2026, 16(1): 1432. doi: 10.1038/s41598-026-05188-x. |
| [1] | 陈会敏, 丁瑞娟, 刘鹤. 肺癌放化疗患者焦虑、抑郁共病与单一情绪障碍的危险因素分析[J]. 临床荟萃, 2026, 41(8): 736-741. |
| [2] | 唐佳, 徐一舟, 吴娇, 张健. C反应蛋白-白蛋白-淋巴细胞指数对肺癌患者预后价值的系统评价与meta分析[J]. 临床荟萃, 2026, 41(6): 493-498. |
| [3] | 林涛, 吴玮君. 中高海拔地区帕金森病非运动症状的临床特征谱及其与肠道菌群-肠-脑轴关联机制[J]. 临床荟萃, 2026, 41(4): 301-306. |
| [4] | 车晓娜, 慕淑丽, 刘宁宁, 崔文婷, 陈金玥, 魏小果. 基于肠道菌群治疗代谢相关脂肪性肝病的研究进展[J]. 临床荟萃, 2026, 41(4): 352-362. |
| [5] | 汤思颖, 贾君萍, 唐雨婷, 郑玉琴, 孔悦. 膳食炎症指数与肺癌风险相关性的meta分析[J]. 临床荟萃, 2026, 41(3): 197-204. |
| [6] | 刘栋, 杨启昌, 李欣然. 抑郁症与肠道菌群关联性的研究进展及趋势分析[J]. 临床荟萃, 2026, 41(3): 285-288. |
| [7] | 陈文江, 舒展, 周来显. 基于核酸适配体的肺癌诊断和治疗研究进展[J]. 临床荟萃, 2025, 40(8): 742-747. |
| [8] | 田晓婷, 卢泽芬. 肺癌患者静脉血栓栓塞危险因素的研究进展[J]. 临床荟萃, 2025, 40(5): 473-476. |
| [9] | 柳玮娜, 柴国静. 血脂代谢与肺癌的相关性研究进展[J]. 临床荟萃, 2025, 40(11): 1031-1034. |
| [10] | 齐玉敏, 王友军. 新生儿胆汁淤积性黄疸血清胆红素水平与肠道菌群失调的相关性[J]. 临床荟萃, 2022, 37(12): 1117-1121. |
| [11] | 黄平, 刘汉芸, 李玉红. 肺癌合并肺栓塞危险因素的Meta分析[J]. 临床荟萃, 2021, 36(12): 1061-1066. |
| [12] | 谭玲玲, 付泓博, 杨茗. 肌少症与肺癌患者预后相关性[J]. 临床荟萃, 2021, 36(12): 1132-1135. |
| [13] | 李雅楠, 侯云霞, 李鸿斌. 肠道菌群与尿酸相关性疾病的研究进展[J]. 临床荟萃, 2021, 36(1): 80-83. |
| [14] | 李双萍, 毛毅敏,和雪改. 改良Wells评分对肺癌合并静脉血栓栓塞症的诊断价值[J]. 临床荟萃, 2020, 35(5): 421-424. |
| [15] | 李百远1,李元军1, 2,高非凡1. 肺结核与肺癌相关性研究进展[J]. 临床荟萃, 2020, 35(10): 943-946. |
| 阅读次数 | ||||||
|
全文 |
|
|||||
|
摘要 |
|
|||||
