
临床荟萃 ›› 2026, Vol. 41 ›› Issue (4): 328-334.doi: 10.3969/j.issn.1004-583X.2026.04.007
任加银a( ), 陈春芹b, 刘发生a, 申辉b
收稿日期:2026-03-11
出版日期:2026-04-20
发布日期:2026-04-24
通讯作者:
任加银,Email: 249746621@qq.com
基金资助:
Ren Jiayina(), Chen Chunqinb, Liu Fashenga, Shen Huib
Received:2026-03-11
Online:2026-04-20
Published:2026-04-24
Contact:
Ren Jiayin,Email: 249746621@qq.com
摘要:
目的 基于常规产前检查指标,构建并验证妊娠期糖尿病(GDM)的列线图预测模型,为早期风险分层提供量化工具。方法 采用回顾性队列研究设计,纳入2018年9月-2024年12月于东莞仁康医院接受产前检查的4 547例单胎孕妇,按7∶3比例随机分为建模队列(3 183例)与内部验证队列(1 364例)。采用LASSO回归筛选变量,并构建多因素logistic回归模型绘制列线图。通过受试者工作特征(ROC)曲线下面积(AUC)、校准曲线及决策曲线分析(DCA)评估模型的区分度、校准度与潜在临床效用。结果 多因素logistic回归分析显示,年龄(OR=1.08,95%CI:1.06~1.09)、孕前体质指数(OR=1.05,95%CI:1.02~1.08)、尿酸(OR=1.00,95%CI:1.00~1.01)、糖化血红蛋白(OR=3.53,95%CI:2.79~4.45)及空腹血糖(OR=2.44,95%CI:1.99~3.00)是GDM的独立预测因素(孕前体质指数P=0.002,余均P<0.01)。该预测模型在建模队列与内部验证队列中AUC值分别为0.723(95%CI:0.703~0.742)和0.720(95%CI:0.690~0.750),显示中等区分度;校准曲线显示预测概率与实际风险吻合良好;DCA提示在0.10~0.80的阈值概率范围内,与全部筛查或全部不筛查策略相比,模型具有潜在的临床净获益。结论 本研究构建的列线图模型基于孕早期常规指标,对GDM发生风险具有中等预测效能,可作为早期风险分层的初步工具。但模型效能仍有提升空间,其普适性及临床实用性需通过多中心外部验证和前瞻性干预试验进一步确认。
中图分类号:
任加银, 陈春芹, 刘发生, 申辉. 基于常规生物标志物的妊娠期糖尿病早期列线图预测模型构建与验证[J]. 临床荟萃, 2026, 41(4): 328-334.
Ren Jiayin, Chen Chunqin, Liu Fasheng, Shen Hui. Development and validation of an early nomogram prediction model for gestational diabetes mellitus based on routine biomarkers[J]. Clinical Focus, 2026, 41(4): 328-334.
| 项目 | 建模队列 ( | 内部验证队列 ( | 性检验) | 建模队列non-GDM ( | 建模队列GDM ( | (组间差异) |
|---|---|---|---|---|---|---|
| 年龄(岁) | 29.0(26.0, 33.0) | 29.0(26.0, 32.0) | 0.657* | 28.0(25.0, 32.0) | 31.0(28.0, 34.0) | <0.01* |
| Pre-BMI | 20.8(19.1, 23.0) | 20.8(19.0, 23.1) | 0.788* | 20.7(18.8, 22.7) | 21.5(19.8, 23.9) | <0.01* |
| 孕次 | 2.00(2.00, 3.00) | 2.00(2.00, 3.00) | 0.714* | 2.00(1.00, 3.00) | 2.00(2.00, 4.00) | 0.010 |
| 产次 | 2.00(1.00, 2.00) | 2.00(1.00, 2.00) | 0.846* | 2.00(1.00, 2.00) | 2.00(2.00, 2.00) | <0.01* |
| ALT(U/L) | 11(8, 15) | 11(8, 15) | 0.791* | 11(8, 15) | 11(8, 16) | 0.013* |
| AST(U/L) | 16.0(14.0, 19.0) | 16.0(14.0, 19.0) | 0.687* | 16.0(14.0, 19.0) | 16.0(14.0, 20.0) | 0.556* |
| TBIL(μmol/L) | 8.5(6.9, 10.6) | 8.6(6.8, 10.7) | 0.366* | 8.5(6.8, 10.5) | 8.6(7.0, 10.7) | 0.465* |
| DBIL(μmol/L) | 2.40(1.70, 3.10) | 2.30(1.70, 3.10) | 0.464* | 2.30(1.70, 3.10) | 2.30(1.70, 3.00) | <0.01* |
| TBA(μmol/L) | 1.90(1.30, 2.80) | 1.90(1.30, 2.85) | 0.722* | 1.90(1.30, 2.90) | 1.80(1.20, 2.80) | 0.015* |
| TP(g/L) | 66.0(63.0, 70.0) | 66.0(63.0, 70.0) | 0.844* | 66.0(63.0, 70.0) | 66.0(63.0, 70.0) | 0.028* |
| ALB(g/L) | 39.0(36.1, 42.0) | 39.4(36.2, 42.0) | 0.461* | 39.2(36.3, 42.2) | 39.0(36.0, 42.0) | 0.123* |
| PA(mg/L) | 232(211, 255) | 232(211, 255) | 0.677* | 231(211, 254) | 236(212, 259) | 0.006* |
| UREA(mmol/L) | 2.67(2.24, 3.16) | 2.67(2.25, 3.18) | 0.449* | 2.65(2.23, 3.13) | 2.72(2.26, 3.23) | 0.019* |
| Cr(μmol/L) | 44(40, 48) | 44(40, 48) | 0.577* | 44(40, 48) | 44(39, 48) | 0.302* |
| UA(μmol/L) | 250(214, 295) | 250(215, 294) | 0.862* | 245(211, 288) | 264(223, 316) | <0.01* |
| CYsC(mg/L) | 0.64(0.55, 0.78) | 0.65(0.55, 0.79) | 0.943* | 0.64(0.55, 0.78) | 0.66(0.56, 0.80) | 0.014* |
| FBG(mmol/L) | 4.80(4.58, 5.04) | 4.80(4.57, 5.04) | 0.453* | 4.75(4.53, 4.98) | 4.94(4.65, 5.20) | <0.01* |
| HbA1c(%) | 4.90(4.70, 5.20) | 4.90(4.70, 5.20) | 0.177* | 4.90(4.60, 5.10) | 5.10(4.80, 5.40) | <0.01* |
| WBC(109/L) | 8.78(7.47, 10.46) | 8.78(7.33, 10.34) | 0.193* | 8.73(7.41, 10.36) | 8.98(7.62, 10.76) | <0.01* |
| NEUT#(109/L) | 6.42(5.32, 7.82) | 6.37(5.24, 7.76) | 0.147* | 6.34(5.26, 7.76) | 6.59(5.45, 8.17) | <0.01* |
| NLR | 3.68(2.94, 4.58) | 3.68(3.00, 4.48) | 0.405* | 3.69(2.96, 4.56) | 3.74(2.98, 4.66) | 0.051* |
| RBC(1012/L) | 3.95(3.67, 4.22) | 3.96(3.65, 4.22) | 0.898* | 3.94(3.66, 4.21) | 3.97(3.70, 4.25) | 0.014* |
| HGB(g/L) | 119(112, 127) | 119(112, 126) | 0.351* | 119(112, 127) | 120(112, 127) | 0.056* |
| RDW-CV(%) | 13.0(12.5, 13.5) | 13.0(12.6, 13.5) | 0.339* | 12.9(12.5, 13.5) | 13.0(12.6, 13.6) | 0.004* |
| TPOAb阳性[例(%)] | 247(7.8) | 109(8.0) | 0.790# | 187(8.3) | 60(6.5) | 0.084# |
| TPOAb阴性[例(%)] | 2 936(92.2) | 1 255(92.0) | 2 070(91.7) | 866(93.5) |
表1 建模队列与内部验证队列及建模队列亚组间基线特征均衡性检验和结局的关系分析
Tab.1 Balance test of baseline characteristics and association with outcomes between the development cohort, internal validation cohort, and subgroups within the development cohort
| 项目 | 建模队列 ( | 内部验证队列 ( | 性检验) | 建模队列non-GDM ( | 建模队列GDM ( | (组间差异) |
|---|---|---|---|---|---|---|
| 年龄(岁) | 29.0(26.0, 33.0) | 29.0(26.0, 32.0) | 0.657* | 28.0(25.0, 32.0) | 31.0(28.0, 34.0) | <0.01* |
| Pre-BMI | 20.8(19.1, 23.0) | 20.8(19.0, 23.1) | 0.788* | 20.7(18.8, 22.7) | 21.5(19.8, 23.9) | <0.01* |
| 孕次 | 2.00(2.00, 3.00) | 2.00(2.00, 3.00) | 0.714* | 2.00(1.00, 3.00) | 2.00(2.00, 4.00) | 0.010 |
| 产次 | 2.00(1.00, 2.00) | 2.00(1.00, 2.00) | 0.846* | 2.00(1.00, 2.00) | 2.00(2.00, 2.00) | <0.01* |
| ALT(U/L) | 11(8, 15) | 11(8, 15) | 0.791* | 11(8, 15) | 11(8, 16) | 0.013* |
| AST(U/L) | 16.0(14.0, 19.0) | 16.0(14.0, 19.0) | 0.687* | 16.0(14.0, 19.0) | 16.0(14.0, 20.0) | 0.556* |
| TBIL(μmol/L) | 8.5(6.9, 10.6) | 8.6(6.8, 10.7) | 0.366* | 8.5(6.8, 10.5) | 8.6(7.0, 10.7) | 0.465* |
| DBIL(μmol/L) | 2.40(1.70, 3.10) | 2.30(1.70, 3.10) | 0.464* | 2.30(1.70, 3.10) | 2.30(1.70, 3.00) | <0.01* |
| TBA(μmol/L) | 1.90(1.30, 2.80) | 1.90(1.30, 2.85) | 0.722* | 1.90(1.30, 2.90) | 1.80(1.20, 2.80) | 0.015* |
| TP(g/L) | 66.0(63.0, 70.0) | 66.0(63.0, 70.0) | 0.844* | 66.0(63.0, 70.0) | 66.0(63.0, 70.0) | 0.028* |
| ALB(g/L) | 39.0(36.1, 42.0) | 39.4(36.2, 42.0) | 0.461* | 39.2(36.3, 42.2) | 39.0(36.0, 42.0) | 0.123* |
| PA(mg/L) | 232(211, 255) | 232(211, 255) | 0.677* | 231(211, 254) | 236(212, 259) | 0.006* |
| UREA(mmol/L) | 2.67(2.24, 3.16) | 2.67(2.25, 3.18) | 0.449* | 2.65(2.23, 3.13) | 2.72(2.26, 3.23) | 0.019* |
| Cr(μmol/L) | 44(40, 48) | 44(40, 48) | 0.577* | 44(40, 48) | 44(39, 48) | 0.302* |
| UA(μmol/L) | 250(214, 295) | 250(215, 294) | 0.862* | 245(211, 288) | 264(223, 316) | <0.01* |
| CYsC(mg/L) | 0.64(0.55, 0.78) | 0.65(0.55, 0.79) | 0.943* | 0.64(0.55, 0.78) | 0.66(0.56, 0.80) | 0.014* |
| FBG(mmol/L) | 4.80(4.58, 5.04) | 4.80(4.57, 5.04) | 0.453* | 4.75(4.53, 4.98) | 4.94(4.65, 5.20) | <0.01* |
| HbA1c(%) | 4.90(4.70, 5.20) | 4.90(4.70, 5.20) | 0.177* | 4.90(4.60, 5.10) | 5.10(4.80, 5.40) | <0.01* |
| WBC(109/L) | 8.78(7.47, 10.46) | 8.78(7.33, 10.34) | 0.193* | 8.73(7.41, 10.36) | 8.98(7.62, 10.76) | <0.01* |
| NEUT#(109/L) | 6.42(5.32, 7.82) | 6.37(5.24, 7.76) | 0.147* | 6.34(5.26, 7.76) | 6.59(5.45, 8.17) | <0.01* |
| NLR | 3.68(2.94, 4.58) | 3.68(3.00, 4.48) | 0.405* | 3.69(2.96, 4.56) | 3.74(2.98, 4.66) | 0.051* |
| RBC(1012/L) | 3.95(3.67, 4.22) | 3.96(3.65, 4.22) | 0.898* | 3.94(3.66, 4.21) | 3.97(3.70, 4.25) | 0.014* |
| HGB(g/L) | 119(112, 127) | 119(112, 126) | 0.351* | 119(112, 127) | 120(112, 127) | 0.056* |
| RDW-CV(%) | 13.0(12.5, 13.5) | 13.0(12.6, 13.5) | 0.339* | 12.9(12.5, 13.5) | 13.0(12.6, 13.6) | 0.004* |
| TPOAb阳性[例(%)] | 247(7.8) | 109(8.0) | 0.790# | 187(8.3) | 60(6.5) | 0.084# |
| TPOAb阴性[例(%)] | 2 936(92.2) | 1 255(92.0) | 2 070(91.7) | 866(93.5) |
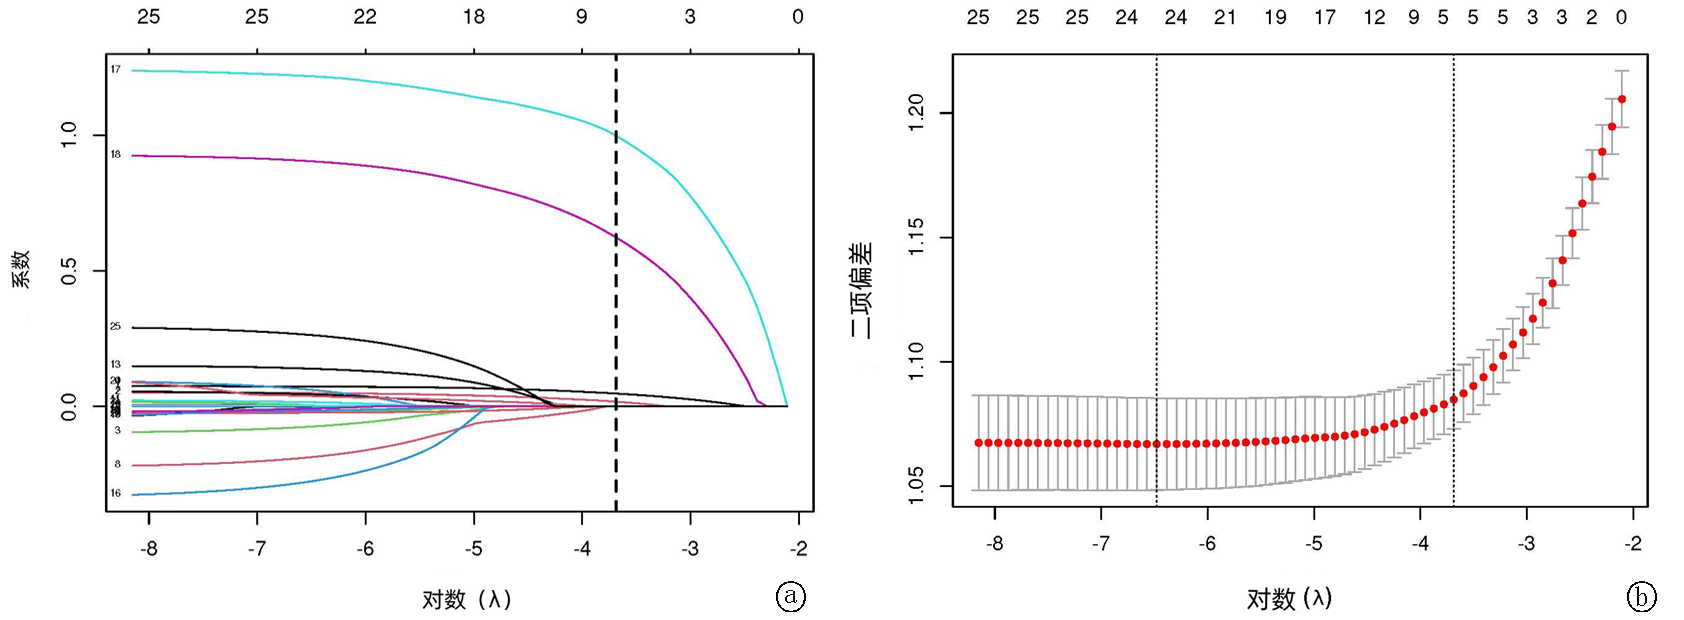
图1 LASSO回归模型用于GDM预测变量的筛选 a.LASSO回归变量选择路径图;b.LASSO回归的交叉验证图,λ.1se=0.02504
Fig. 1 LASSO regression model for selecting predictive variables for GDM a. LASSO variable selection path; b. LASSO cross-validation plot, λ.1se=0.02504
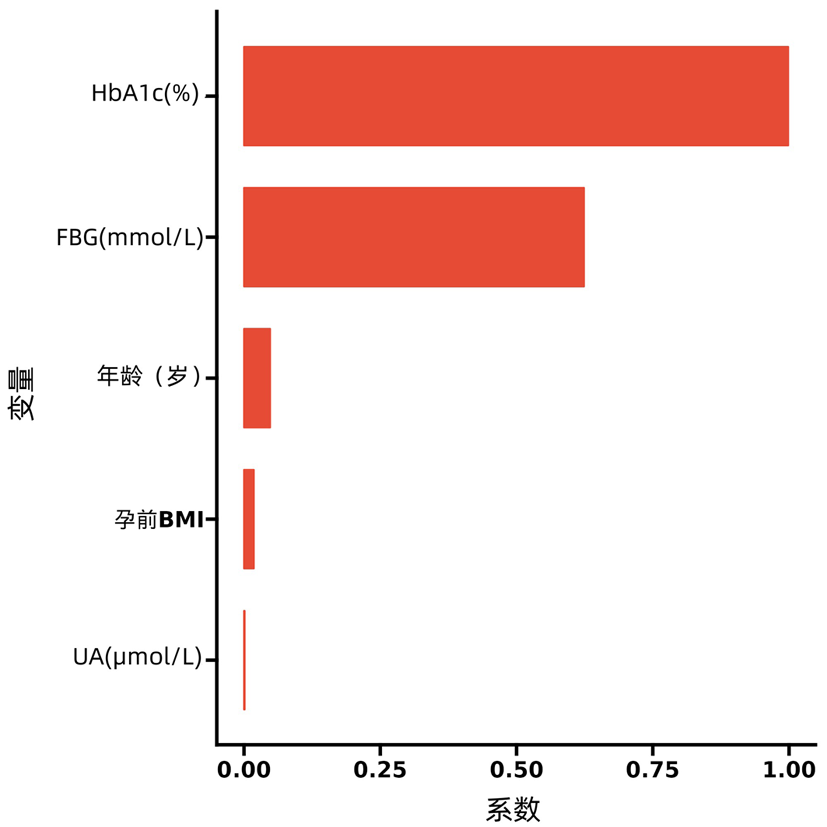
图2 经过Lasso选择的预测变量及其对应的系数的直方图
Fig. 2 Histogram of predictive variables selected by LASSO and their corresponding coefficients
| 变量 | 建模队列 | GDM | OR(95% | AUC(95% | |
|---|---|---|---|---|---|
| 年龄(岁) | 3 183 | 926 | 1.10(1.08, 1.11) | <0.01 | 0.629(0.608-0.650) |
| pre-BMI | 3 183 | 926 | 1.11(1.08, 1.15) | <0.01 | 0.587(0.566-0.607) |
| UA(μmol/L) | 3 183 | 926 | 1.00(1.00, 1.01) | <0.01 | 0.574(0.552-0.595) |
| HbA1c(%) | 3 183 | 926 | 5.22(4.17, 6.53) | <0.01 | 0.664(0.643-0.685) |
| FBG(mmol/L) | 3 183 | 926 | 3.18(2.62, 3.85) | <0.01 | 0.628(0.607-0.650) |
表2 单变量logistic回归及单个自变量预测的AUC值
Tab.2 Univariate logistic regression and AUC values for individual predictors
| 变量 | 建模队列 | GDM | OR(95% | AUC(95% | |
|---|---|---|---|---|---|
| 年龄(岁) | 3 183 | 926 | 1.10(1.08, 1.11) | <0.01 | 0.629(0.608-0.650) |
| pre-BMI | 3 183 | 926 | 1.11(1.08, 1.15) | <0.01 | 0.587(0.566-0.607) |
| UA(μmol/L) | 3 183 | 926 | 1.00(1.00, 1.01) | <0.01 | 0.574(0.552-0.595) |
| HbA1c(%) | 3 183 | 926 | 5.22(4.17, 6.53) | <0.01 | 0.664(0.643-0.685) |
| FBG(mmol/L) | 3 183 | 926 | 3.18(2.62, 3.85) | <0.01 | 0.628(0.607-0.650) |
| 变量 | 建模队列 | GDM | OR(95% | |
|---|---|---|---|---|
| 年龄(岁) | 3 183 | 926 | 1.08(1.06, 1.09) | <0.01 |
| pre-BMI | 3 183 | 926 | 1.05(1.02, 1.08) | 0.002 |
| UA(μmol/L) | 3 183 | 926 | 1.00(1.00, 1.01) | <0.01 |
| HbA1c(%) | 3 183 | 926 | 3.53(2.79, 4.45) | <0.01 |
| FBG(mmol/L) | 3 183 | 926 | 2.44(1.99, 3.00) | <0.01 |
表3 建模队列多变量logistic回归结果
Tab.3 Multivariate logistic regression results in the development cohort
| 变量 | 建模队列 | GDM | OR(95% | |
|---|---|---|---|---|
| 年龄(岁) | 3 183 | 926 | 1.08(1.06, 1.09) | <0.01 |
| pre-BMI | 3 183 | 926 | 1.05(1.02, 1.08) | 0.002 |
| UA(μmol/L) | 3 183 | 926 | 1.00(1.00, 1.01) | <0.01 |
| HbA1c(%) | 3 183 | 926 | 3.53(2.79, 4.45) | <0.01 |
| FBG(mmol/L) | 3 183 | 926 | 2.44(1.99, 3.00) | <0.01 |
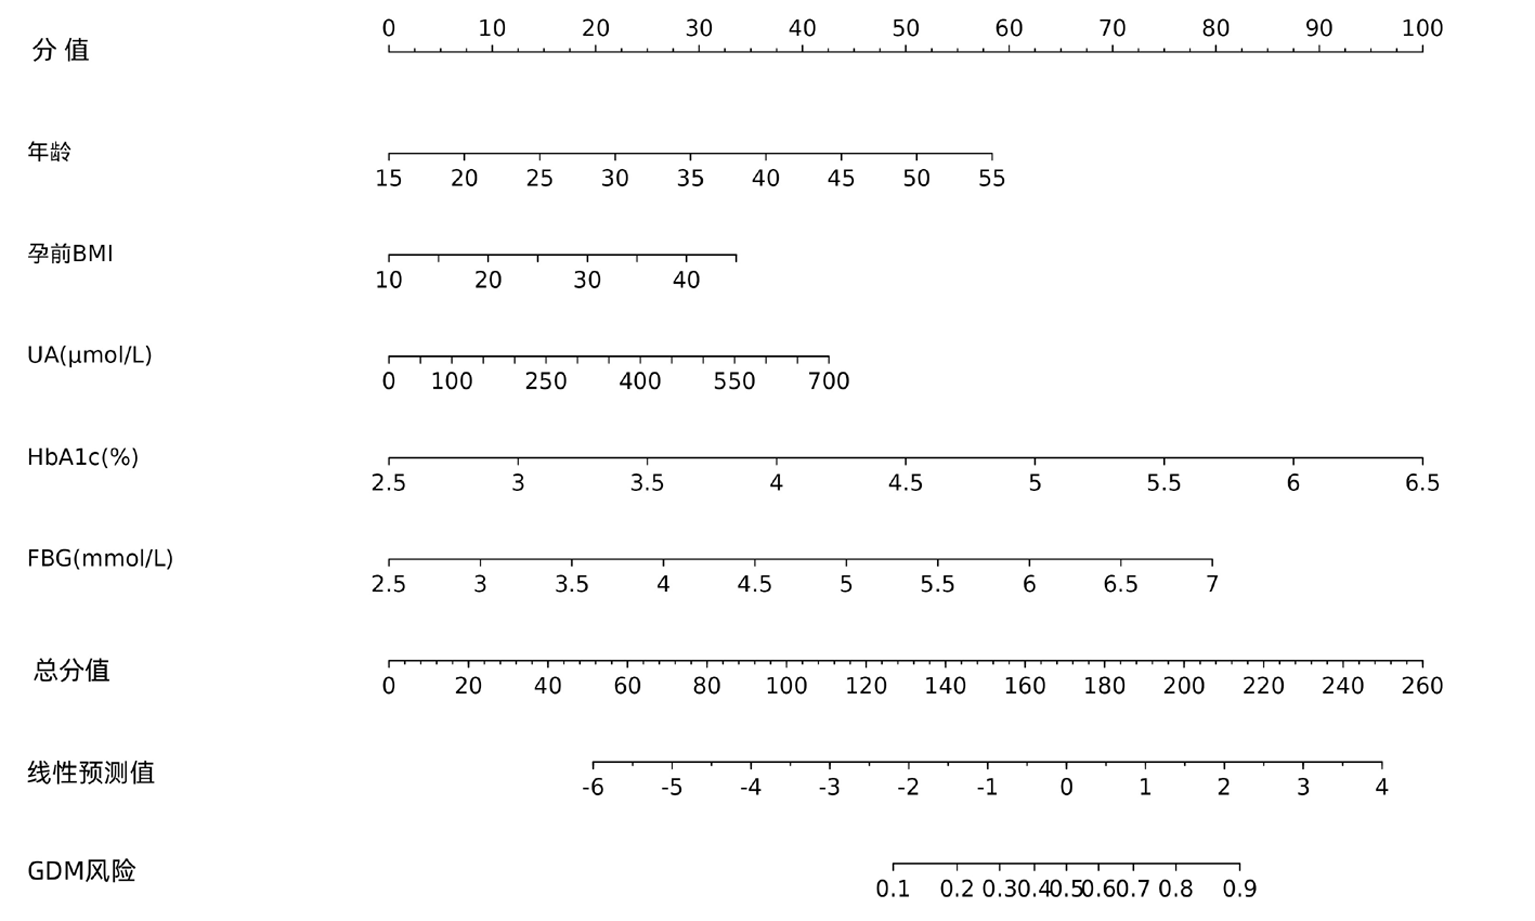
图3 建模队列开发的列线图
Fig.3 Nomogram developed in the development cohort
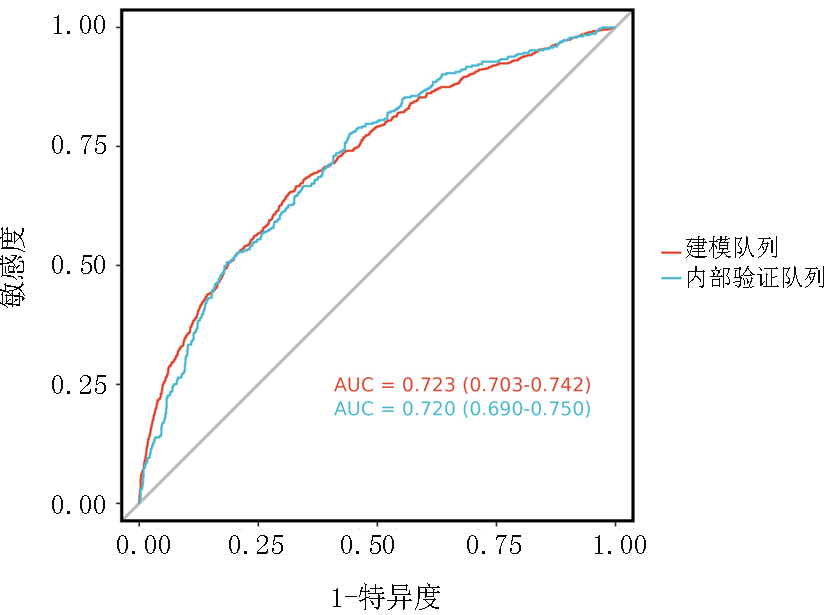
图4 预测模型在队列中的ROC曲线
Fig.4 ROC curve of the prediction model in the cohort
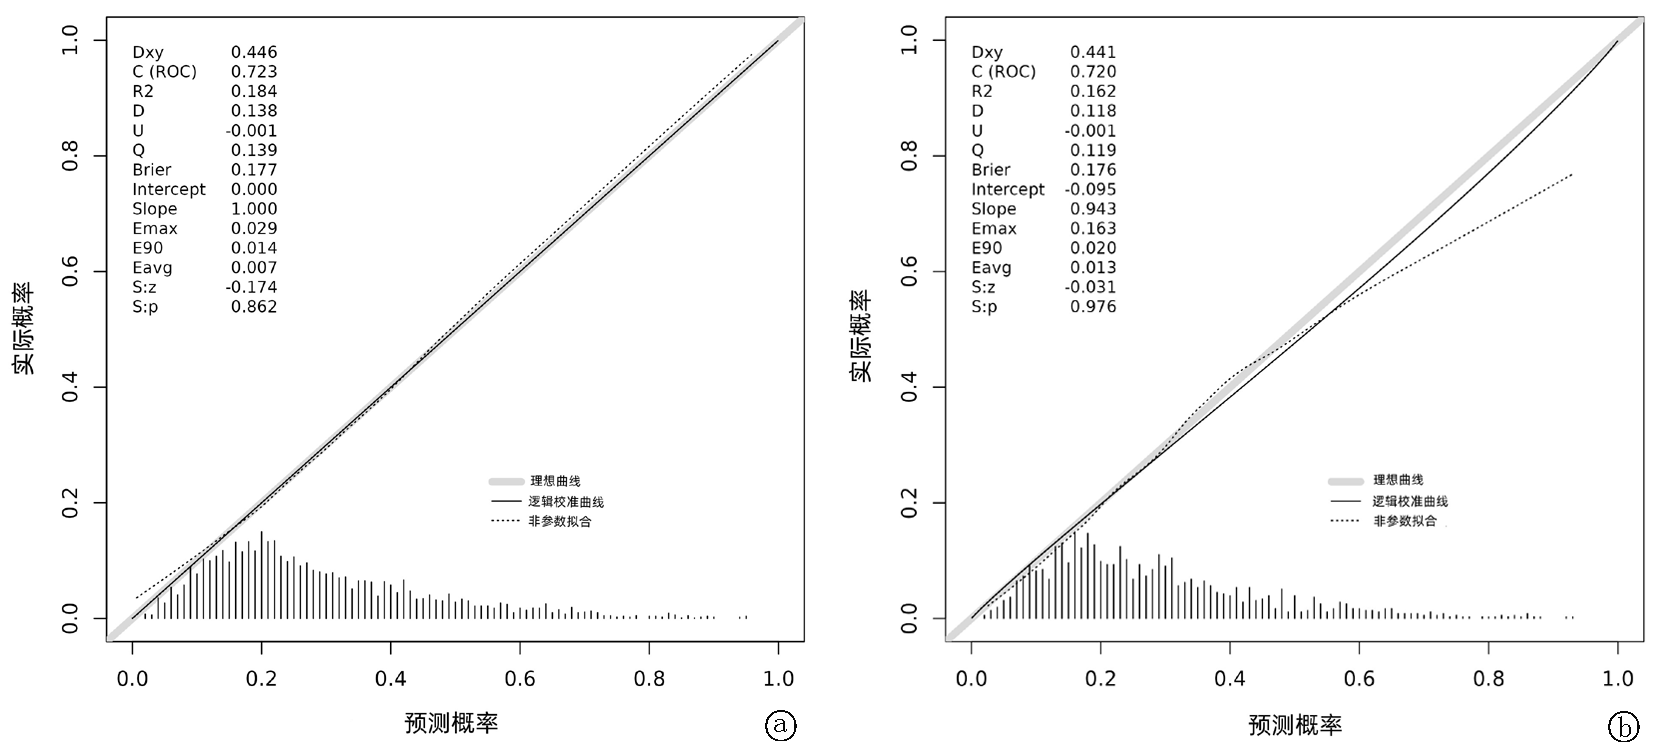
图5 列线图预测模型的校准曲线 a.基于建模队列的校准曲线;b.基于内部验证队列的校准曲线
Fig.5 Calibration curves of the nomogram prediction model a. based on the development cohort; b. based on the internal validation cohort
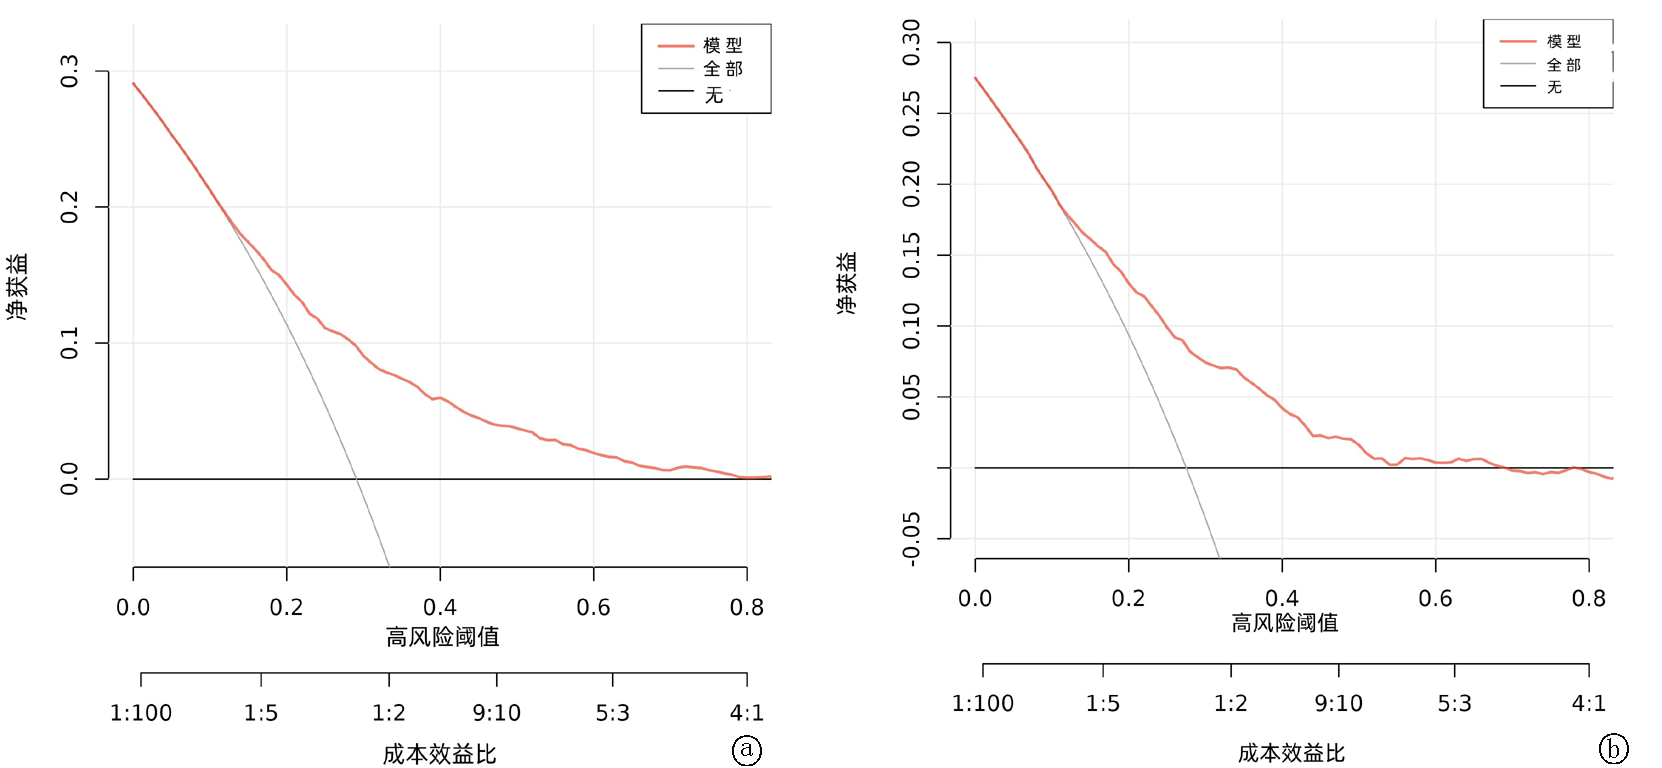
图6 模型决策曲线分析 a.基于建模队列决策曲线分析;b.基于内部验证队列决策曲线分析
Fig.6 Decision curve analysis of the model a. based on the development cohort; b. based on the internal validation cohort
| [1] | Assani MZ, Boldeanu L, Manolea MM, et al. From molecular insights to clinical management of gestational diabetes mellitus-a narrative review[J]. Int J Mol Sci, 2025, 26(17):8719. doi:10.3390/ijms26178719. |
| [2] | Zhang Z, Zhang Y, Huang S, et al. Influence of gestational diabetes mellitus on the cardiovascular system and its underlying mechanisms[J]. Front Endocrinol (Lausanne), 2025, 16:1474643. doi:10.3389/fendo.2025.1474643. |
| [3] |
Sweeting A, Hare MJ, de Jersey SJ, et al. Australasian Diabetes in Pregnancy Society (ADIPS) 2025 consensus recommendations for the screening, diagnosis and classification of gestational diabetes[J]. Med J Aust, 2025, 223(3):161-167. doi:10.5694/mja2.52696.
pmid: 40544364 |
| [4] |
Sweeting A, Wong J, Murphy HR, et al. A clinical update on gestational diabetes mellitus[J]. Endocr Rev, 2022, 43(5):763-793. doi:10.1210/endrev/bnac003.
pmid: 35041752 |
| [5] |
Zhang L, Yan X, Zheng W, et al. Assessment of first-trimester insulin resistance indices for gestational diabetes mellitus: A prospective cohort study[J]. J Endocrinol Invest, 2025, 48(9):2167-2176.doi:10.1007/s40618-025-02630-4.
pmid: 40650817 |
| [6] | Song S, Luo Q, Zhong X, et al. An elevated triglyceride-glucose index in the first-trimester predicts adverse pregnancy outcomes: A retrospective cohort study[J]. Arch Gynecol Obstet, 2025, 311(3):915-927.doi:10.1007/s00404-025-07973-0. |
| [7] |
Jagriti, Prabhat, Jain A, et al. Gestational diabetes mellitus (GDM): Diagnosis using biochemical parameters and anthropometric measurements during the first trimester in the Indian population[J]. Horm Mol Biol Clin Investig, 2024, 46(2):77-83. doi:10.1515/hmbci-2024-0040.
pmid: 39526985 |
| [8] |
International Association of Diabetes and Pregnancy Study Groups Consensus Panel, Metzger BE, Gabbe SG, et al. International association of diabetes and pregnancy study groups recommendations on the diagnosis and classification of hyperglycemia in pregnancy[J]. Diabetes Care, 2010, 33(3):676-682. doi:10.2337/dc09-1848.
pmid: 20190296 |
| [9] | 尚红, 王毓三, 申子瑜. 全国临床检验操作规程[M]. 4版. 北京: 人民卫生出版社,2015:200-281. |
| [10] |
Abdul-Ghani MA, Tripathy D, DeFronzo RA. Contributions of beta-cell dysfunction and insulin resistance to the pathogenesis of impaired glucose tolerance and impaired fasting glucose[J]. Diabetes Care, 2006, 29(5):1130-1139. doi:10.2337/diacare.2951130.
pmid: 16644654 |
| [11] | 陈淑萍, 丁锦根, 郑珠莲. 孕早期空腹血糖、餐后2 h血糖及糖化血红蛋白联合检测在妊娠期糖尿病中的诊断价值[J]. 糖尿病新世界, 2024, 27(4):53-55.doi:10.16658/j.cnki.1672-4062.2024.04.053. |
| [12] |
Wrench E, Subar DA, Bampouras TM, et al. Myths and methodologies: Assessing glycaemic control and associated regulatory mechanisms in human physiology research[J]. Exp Physiol, 2024, 109(9):1461-1477. doi:10.1113/EP091433.
pmid: 39014995 |
| [13] |
Yang M, Wei Y, Liu J, et al. Contributions of hepatic insulin resistance and islet β-cell dysfunction to the blood glucose spectrum in newly diagnosed type 2 diabetes mellitus[J]. Diabetes Metab J, 2025, 49(4):883-892. doi:10.4093/dmj.2024.0537.
pmid: 39943844 |
| [14] | Su S, Zhang E, Gao S, et al. Serum uric acid and the risk of gestational diabetes mellitus: A systematic review and meta-analysis[J]. Gynecol Endocrinol, 2023, 39(1):2231101. doi:10.1080/09513590.2023.2231101. |
| [15] | Zhi L, Yuzhang Z, Tianliang H, et al. High uric acid induces insulin resistance in cardiomyocytes in vitro and in vivo[J]. PLoS One, 2016, 11(2):e0147737. doi:10.1371/journal.pone.0147737. |
| [16] | 李阳, 蒋玉芬, 李奕. 妊娠期糖尿病患者发病的危险因素及炎性应激状态分析[J]. 实用临床医药杂志, 2025, 29(4):64-68. |
| [17] | Li Y, Ren X, He L, et al. Maternal age and the risk of gestational diabetes mellitus: A systematic review and meta-analysis of over 120 million participants[J]. Diabetes Res Clin Pract, 2020, 162:108044. doi:10.1016/j.diabres.2020.108044. |
| [18] | Zhang H, Dai J, Zhang W, et al. Integration of clinical demographics and routine laboratory analysis parameters for early prediction of gestational diabetes mellitus in the Chinese population[J]. Front Endocrinol (Lausanne), 2023, 14:1216832. doi:10.3389/fendo.2023.1216832. |
| [19] | Kang M, Zhang H, Zhang J, et al. A novel nomogram for predicting gestational diabetes mellitus during early pregnancy[J]. Front Endocrinol (Lausanne), 2021, 12:779210. doi:10.3389/fendo.2021.779210. |
| [20] |
Li R, Yuan K, Yu X, et al. Construction and validation of risk prediction model for gestational diabetes based on a nomogram[J]. Am J Transl Res, 2023, 15(2):1223-1230.
pmid: 36915791 |
| [21] | Zhu T, Tang L, Qin M, et al. Prediction of Gestational Diabetes Mellitus (GDM) risk in early pregnancy based on clinical data and ultrasound information: A nomogram[J]. BMC Med Inform Decis Mak, 2025, 25(1):138. doi:10.1186/s12911-025-02962-4. |
| [22] | Han W, Song Y, Xu Y, et al. Association analysis of MTHFR (C677T, A1298C) and MTRR (A66G) gene polymorphisms on susceptibility to gestational diabetes mellitus in Chinese pregnant women[J]. Gynecol Endocrinol, 2025, 41(1):2565256. doi:10.1080/09513590.2025.2565256. |
| [23] |
Huang G, Sun Y, Li R, et al. Functional genetic variants and susceptibility and prediction of gestational diabetes mellitus[J]. Sci Rep, 2024, 14(1):18123. doi:10.1038/s41598-024-69079-y.
pmid: 39103437 |
| [24] |
Liang Q, Li M, Huang G, et al. Genetic susceptibility, mendelian randomization, and nomogram model construction of gestational diabetes mellitus[J]. J Clin Endocrinol Metab, 2024, 109(11):2802-2814. doi:10.1210/clinem/dgae200.
pmid: 38625888 |
| [25] | 魏曼, 苑文贺, 刘红云, 等. 妊娠期糖尿病患者血清分泌性卷曲相关蛋白-5、热休克蛋白60、溶质载体家族16成员11的表达及其与胰岛素抵抗的关系[J]. 实用临床医药杂志, 2024, 28(20):60-65. |
| [1] | 姜少利, 闫国胜, 李丽丽. 终末期维持性血液透析患者营养不良-炎症复合综合征发生情况及其危险因素[J]. 临床荟萃, 2026, 41(4): 312-317. |
| [2] | 王鹏, 余玲, 胥力川, 庞敏, 李果, 郑洪锟, 张全波, 青玉凤. 原发性痛风患者发生骨质疏松症的危险因素分析及预测模型构建[J]. 临床荟萃, 2026, 41(4): 323-327. |
| [3] | 解丽然, 桑艳红, 余玲, 饶小娟, 王姗姗, 赵明明. 2022年河南省糖尿病居民健康状况及影响因素调查[J]. 临床荟萃, 2026, 41(4): 335-340. |
| [4] | 祝孟丽, 李敏, 薛莎莎, 蔚苗苗, 付慧娟. 基于机器学习整合多维危险因素的急性失代偿性心力衰竭患者再住院风险预测模型[J]. 临床荟萃, 2026, 41(3): 205-211. |
| [5] | 廖宇宁, 钟美兴, 林小芳. 重型颅脑损伤患者感染耐碳青霉烯类肺炎克雷伯菌的耐药性及列线图模型构建[J]. 临床荟萃, 2026, 41(3): 212-218. |
| [6] | 王鑫汇, 张家梦, 刘跟莉. 双胎妊娠早产危险因素的meta分析[J]. 临床荟萃, 2026, 41(2): 101-107. |
| [7] | 汪晶晶, 江茜茜, 高炬, 周叶苹. 基于LASSO-logistic回归构建维持性血液透析患者睡眠障碍风险预测模型[J]. 临床荟萃, 2026, 41(2): 148-154. |
| [8] | 孙萌萌, 张志功. 基于孟德尔随机化及生物信息学分析探讨糖尿病与外周动脉粥样硬化的关联性及关键基因、通路研究[J]. 临床荟萃, 2026, 41(1): 24-32. |
| [9] | 向喻欣, 钟宇豪. 认知行为疗法对2型糖尿病患者抑郁症状干预效果的meta分析[J]. 临床荟萃, 2026, 41(1): 5-11. |
| [10] | 韦婷婷, 潘正燕, 冯鲜燕, 龙亚秀. 基于SEER数据库的结直肠癌肝转移危险因素分析:倾向评分匹配研究[J]. 临床荟萃, 2025, 40(9): 816-820. |
| [11] | 杨威娜, 虞曼榆, 詹明. 线粒体质量控制与糖尿病肾脏疾病的研究进展[J]. 临床荟萃, 2025, 40(9): 844-849. |
| [12] | 马良, Severine Martin, 孙广东. 基于加蓬数据的疟疾相关急性肾损伤患者临床特征分析[J]. 临床荟萃, 2025, 40(8): 717-720. |
| [13] | 肇雪婷, 白佳雯, 孙军. 代谢相关脂肪性肝病肝纤维化危险因素分析及构建预测模型[J]. 临床荟萃, 2025, 40(5): 417-422. |
| [14] | 肖珂, 王奇. 2型糖尿病伴隐球菌性脑膜炎患者的临床特征及危险因素分析[J]. 临床荟萃, 2025, 40(5): 423-427. |
| [15] | 田晓婷, 卢泽芬. 肺癌患者静脉血栓栓塞危险因素的研究进展[J]. 临床荟萃, 2025, 40(5): 473-476. |
| 阅读次数 | ||||||
|
全文 |
|
|||||
|
摘要 |
|
|||||